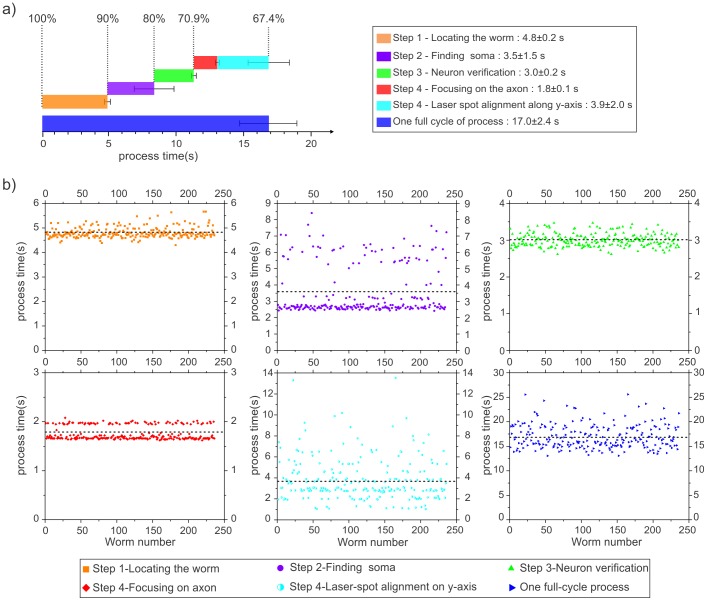
Figure 7. Success rate and timing performance of the automation.
a) The average times required to perform a successful automated axotomy in single neuron per animal for each individual step of the automation process are indicated with colored bars. The accompanying error bars indicate the standard deviations measured from two different sets of experiments with a total number of successfully axotomized worms of n = 236. The average percentages of worms remaining (from all the processed worms, n = 350) after each step is given above each corresponding time bar at the top of the figure. b) Timing of automation steps for each successful trapping experiment (n = 236). Timing of each step for the same worm is addressed with the same worm number for each graph.

