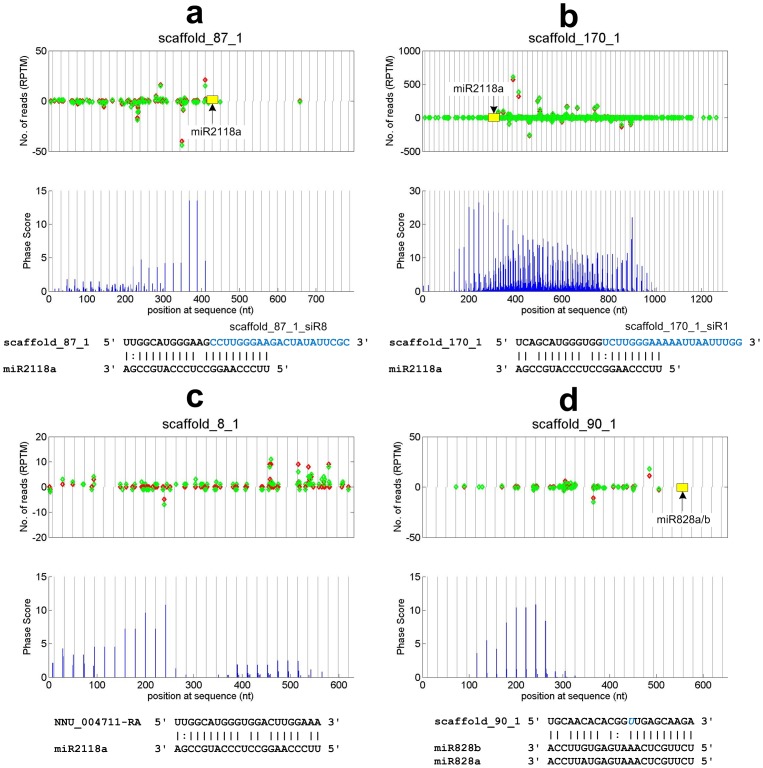
Figure 2. The read distributions and phase scores of some predicted PHAS loci from NB-LRR disease resistance proteins and a MYB transcription factor.
The red and green diamonds represent the number of 21 nt reads, vertical axis, that appeared at the position of the PHAS loci, horizontal axis, in the flower and leaf small RNA libraries, respectively. The vertical gray lines with distances of 21 nt are the phased positions from the position with highest phase scores of the PHAS loci. The yellow boxes in the read distribution panel represent the miRNA complementary sites. Sites pointed by miRNAs from above and under zero read line means miRNAs complement to the plus and minus strand of the predicted PHAS loci, respectively. The predicted miR2118a complementary sites are shown below the phase score panel. (a) to (c) Three potential PHAS loci, scaffold_87_1, scaffold_170_1 and scaffold_8_1, from NB-LRR disease resistance proteins. The blue sequences in the complementary sites of (a) and (b) are one of the phasiRNAs from the PHAS loci. The miR2118a site in Part c is at 176 nt 5′ side (upstream) of the PHAS locus scaffold_8_1. (d) scaffold_90_1, from an MYB90 transcription factor locus.

