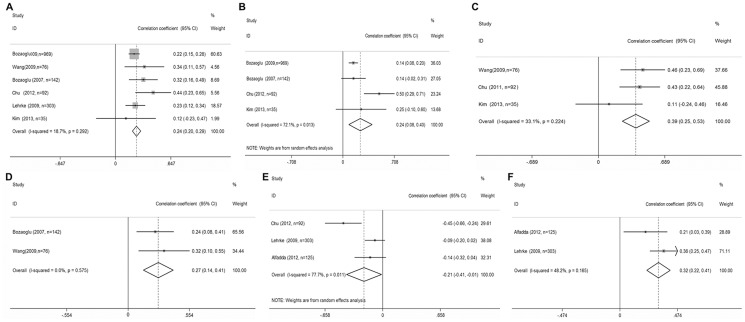
Figure 4. Correlations between serum chemerin concentrations and obesity markers in Obesity or MS subjects.
Summaries are shown of the correlations between chemerin concentrations and (a) body mass index, (b) total body fat (%), (c) waist circumference, (d) waist-hip ratio, (e) Adiponectin and (f) Leptin. 95% confidence intervals (CIs) are represented by the horizontal lines, and diamonds represent the overall estimate and 95% CI.

