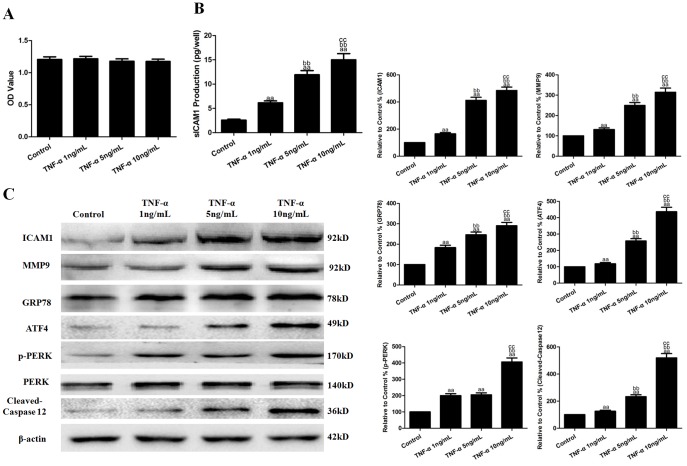
Figure 1. Effects of TNF-α on cell viability, inflammatory cytokines and ERS-related molecules.
A. Cell viability is expressed as an OD value. B. The levels of sICAM1 in cell culture supernatants. C. Representative Western blot results showing ICAM1, MMP9, GRP78, ATF4, cleaved-caspase12, p-PERK and PERK protein expression. The results are expressed as the means ±SD, n = 6. aaP<0.01, compared with the control group; bbP<0.01, compared with the 1 ng/mL TNF-α group; ccP<0.01, compared with the 5 ng/mL TNF-α group. EP, ethyl pyruvate; OD, optical density.

