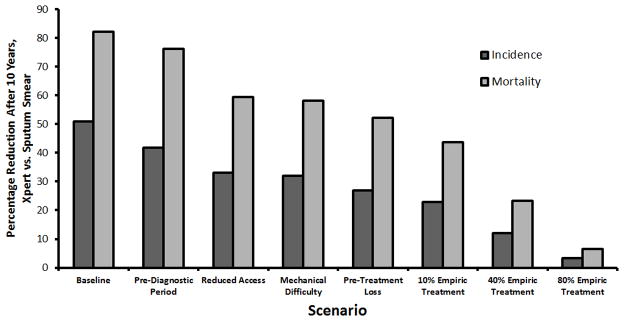
Figure. The Diagnostic Cascade in Tuberculosis.

Shown are the expected reductions in tuberculosis incidence (dark bars) and mortality (light bars) ten years after full replacement of sputum smear microscopy with Xpert MTB/RIF. Each sequential step to the right of the graph incorporates an additional element of tuberculosis diagnosis that may reduce the number of individuals benefiting from a more sensitive diagnostic test.
