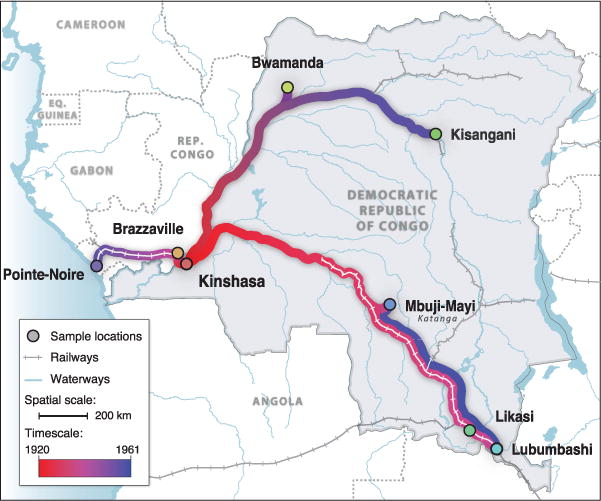
Fig. 2. Spatial dynamics of HIV-1 group M spread.

Circles represent sampled locations and are colored according to the estimated time of introduction of HIV-1 group M from Kinshasa. Strongly supported rates of virus spatial movement (table S6) are projected along the transportation network for the DRC (railways and waterways), which was fully operational until 1960 (38). Gradient colors depict the time scale of spatial movements (bottom left).
