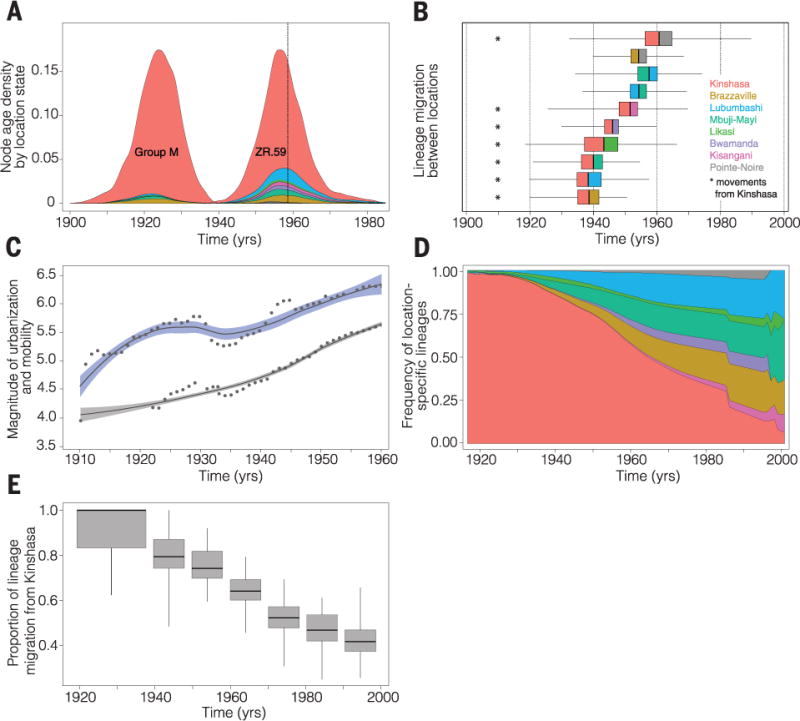
Fig. 3. HIV-1 group M establishment, human mobility, and urbanization.

(A) Posterior probability densities for the estimated age of the most recent common ancestor of HIV-1 group M and of the archival ZR59 sequence. Distributions are stratified according to the estimated locations of both nodes (location-specific colors correspond to those in Fig. 1). A vertical dotted line shows the known sampling date for ZR59 (1959). (B) Earliest dates of lineage migration for significant routes of group M dispersal in the DRC and RC (table S6). Each box-and-whisker plot represents movement between a pair of locations. The vertical bar in each box represents the earliest date of movement, and colors to the left and right of this bar represent the seeding and receiving locations, respectively. The width of the boxes and the whiskers represents the 25-to-75% and 2.5-to-97.5% percentiles, respectively, of the estimated date of earliest movement. (C) Locally weighted regression curves for the official total number of passengers (log10) transported along railways (95% of journeys) and waterways (5%) in the DRC (38) (blue) and for the human population size (log10) of Kinshasa (gray) between 1900 and 1960 (43), after which reliable transportation data are unavailable. Dots show regression data points. (D) Estimated frequency of group M lineages at each location in the DRC and RC through time. (E) Estimated proportion of all migration events that began in Kinshasa until 1940 and, per decade, between 1940 and 2000. [Box-and-whisker widths are defined in (B).] This percentage drops to 43.5% between 1990 and 2000 (fig. S6 shows the estimated proportion of movement events originating from each location).
