
Figure 1.
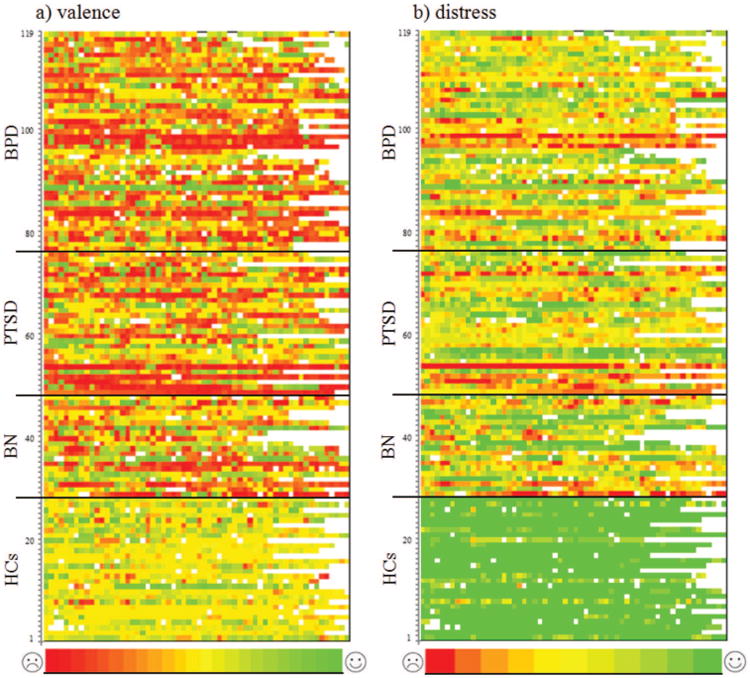
Color-coded (a) valence and (b) distress ratings of patients with borderline personality disorder (BPD), patients with posttraumatic stress disorder (PTSD), patients with bulimia nervosa (BN), and healthy controls (HC) over the 24-hr assessment period. Each row represents a subject (HC = Rows 1–28; BN = Rows 29–48; PTSD = Rows 49–76; BPD = Rows 77–119), and each square represents a 15-min self-report interval. The color denotes the level of valence and distress (valence ratings: −11 to 11, i.e., 23 categories that range from red to green, where red represents negative affective states, yellow represents neutral affect, and green represents positive affective states; distress ratings: 0 to 10, i.e., 11 categories that range from red to green, where red represents high distress and green represents low distress). White squares represent missing data. a: The upper portion of the figure from Lines 29 to 119 is mostly red, orange, and yellow, which represents the medium and negative valence ratings in the three investigated patients groups. However, different shades of green are also represented. Thus, patients' ratings varied over the full range of valence states. In contrast, the lower portion of the figure is mostly yellow and green, which depicts the medium to positive valence ratings of the healthy controls. The frequent and fast changes in color in the upper two thirds of the figure represent the instability of the patient groups. b: The colors of the figure from Lines 29 to 119 largely vary across red, orange, yellow, and green tones. Thus, the ratings in the three patient groups again varied over the full range of distress. The lower portion of the figure is mostly green, which depicts the low distress self-reports of the healthy controls. Again, the frequent and fast changes of color in the upper two thirds of the figure represent the instability of the patient groups.