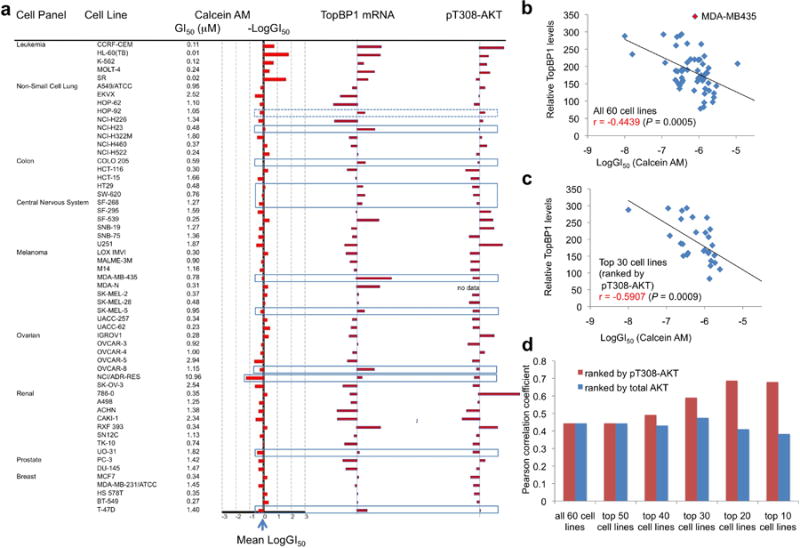
Figure 6.

Calcein AM sensitivity correlates with TopBP1 expression and Akt activity in NCI-60 cancer cell lines.
(a) The sensitivity to Calcein AM (NSC 689290) and TopBP1 mRNA levels (GC181500) and pT308-AKT levels by RPPA (MT18349) in NCI-60 cell lines were extracted from NCI-DTP server. Box lines highlight the cell lines with discrepancy in LogGI50 and TopBP1 mRNA levels. Most of the discrepancy was found in cells with low pT308-AKT levels except HOP-92 cells (dotted box).
(b) The correlation between the sensitivity of NCI-60 cell lines to Calcein AM (expressed as LogGI50, the concentration that causes 50% growth inhibition) and TopBP1 RNA levels in these cell lines. Pearson correlation coefficient (r) and P value are shown.
(c) Only the top 30 cell lines with a higher level of pT308-AKT are included in this correlative analysis.
(d) The NCI-60 cell lines were ranked according to either pT308-AKT or total AKT expression levels followed by the correlative analysis with TopBP1 expression for the selected cell lines.
