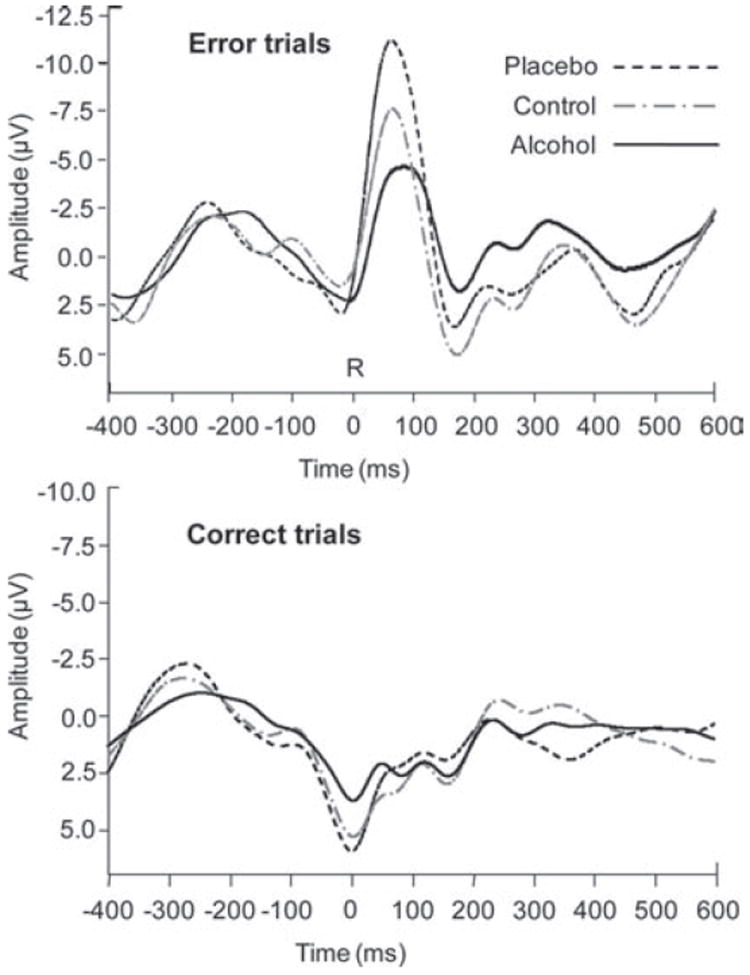
Figure 4.

Response-locked ERP waveforms measured at electrode FCz on error trials (top panel) and on correct trials (bottom panel), as a function of beverage group. ‘R’ (time zero) indicates response onset. The ERN is visible as the prominent negativity peaking approximately 80 ms post-response on error trials; the Pe is the positivity following the ERN, peaking approximately 160 ms postresponse on error trials.
