
Figure 7.
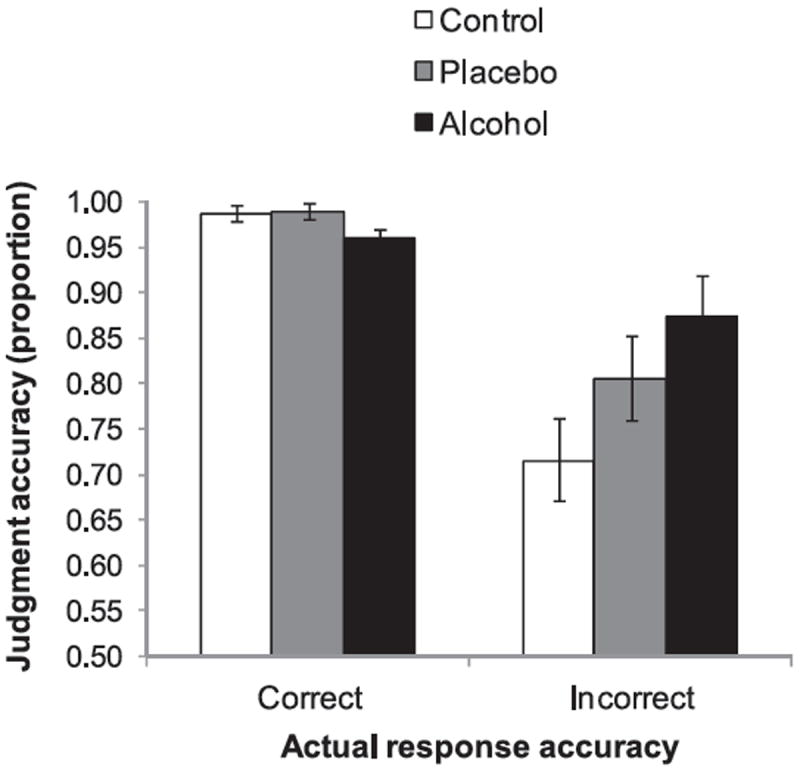
Response accuracy judgments for correct and incorrect response trials as a function of beverage group. Analyses were carried out using the arcsine of the square root of accuracy rates (proportions), which reduces skew in the distribution and makes the data more suitable for analysis of variance. However, for ease of interpretation the untransformed data are presented here. Vertical bars represent ± 1 SE.