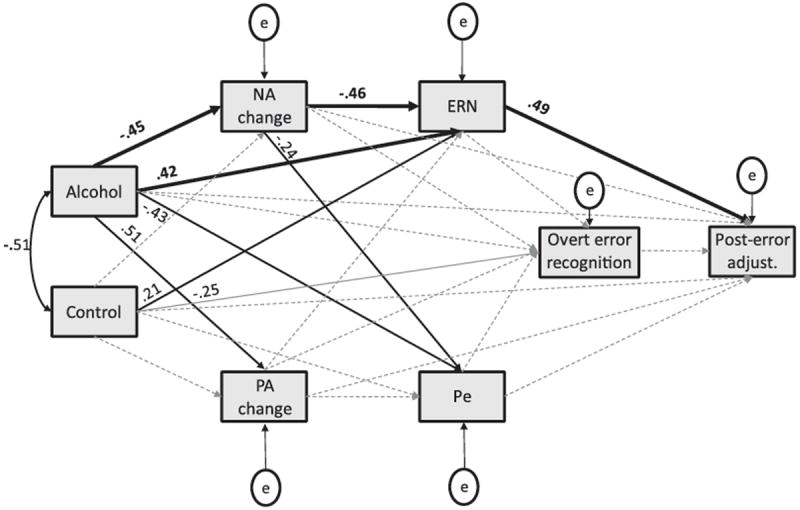
Figure 8.

Structural equation model depicting associations among study variables. Significant associations are depicted with solid lines. Paths associated with significant indirect effects are shown in bold. Nonsignificant associations are depicted with dashed lines. Effects for the Alcohol and Control variables represent effects relative to the placebo group. NA change and PA change = change from baseline to the first postdrinking assessment in negative affect and positive affect, respectively. ERN and Pe = average amplitude of those components at the electrode site where they were largest (FCz and Cz, respectively). Overt error recognition represents the proportion of incorrect responses judged as errors. Posterror adjust. = average RT interference effect on trials that followed errors. Error terms of the NA change and PA change variables, as well as the ERN and Pe variables, were correlated in the model (neither was significant), but those paths were not depicted in the figure in order to reduce clutter.
