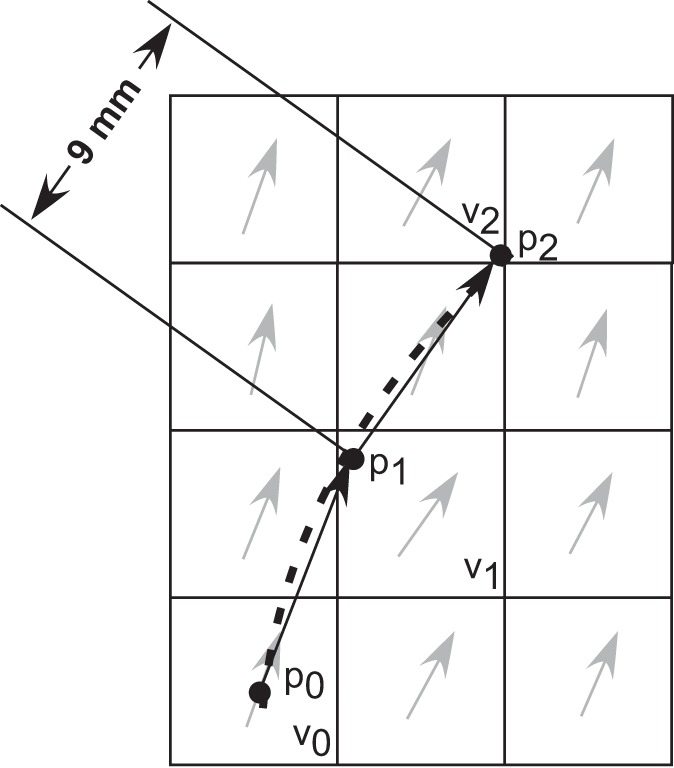
Fig. 1.

Two-dimensional (2D) representation of a tracked fascicle segment with the squares representing the voxels in the grid and arrows represent the fascicle orientation in the voxels. The tracking started at po in the orientation at vo to obtain p1 at a distance of 9 mm from po. p2 Was obtained in the direction of orientation in v1 and at a distance of 9 mm from p1. The dotted line represents the 2nd degree fit function. The tracking was performed in a 3-dimensional (3D) grid, and the 2D drawing is for simplicity.
