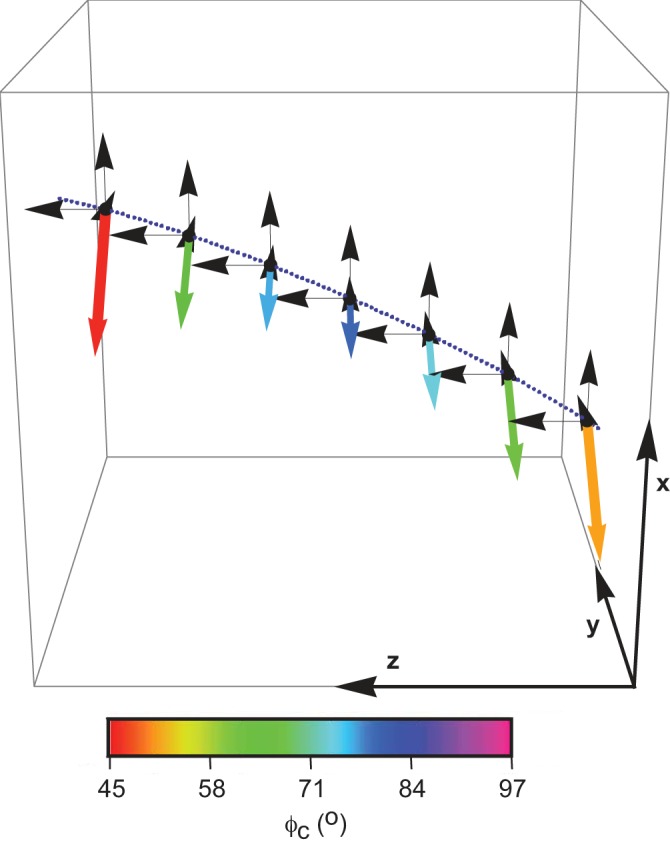
Fig. 7.

Schematic representation of the fascicle curvature in 3D. The path of the fascicle is shown by the blue dotted line. The curvature was represented by magnitude (represented by length of arrow) and azimuthal angle (represented by color of arrow). Polar angle (βc) was constant in this case at 90°.
