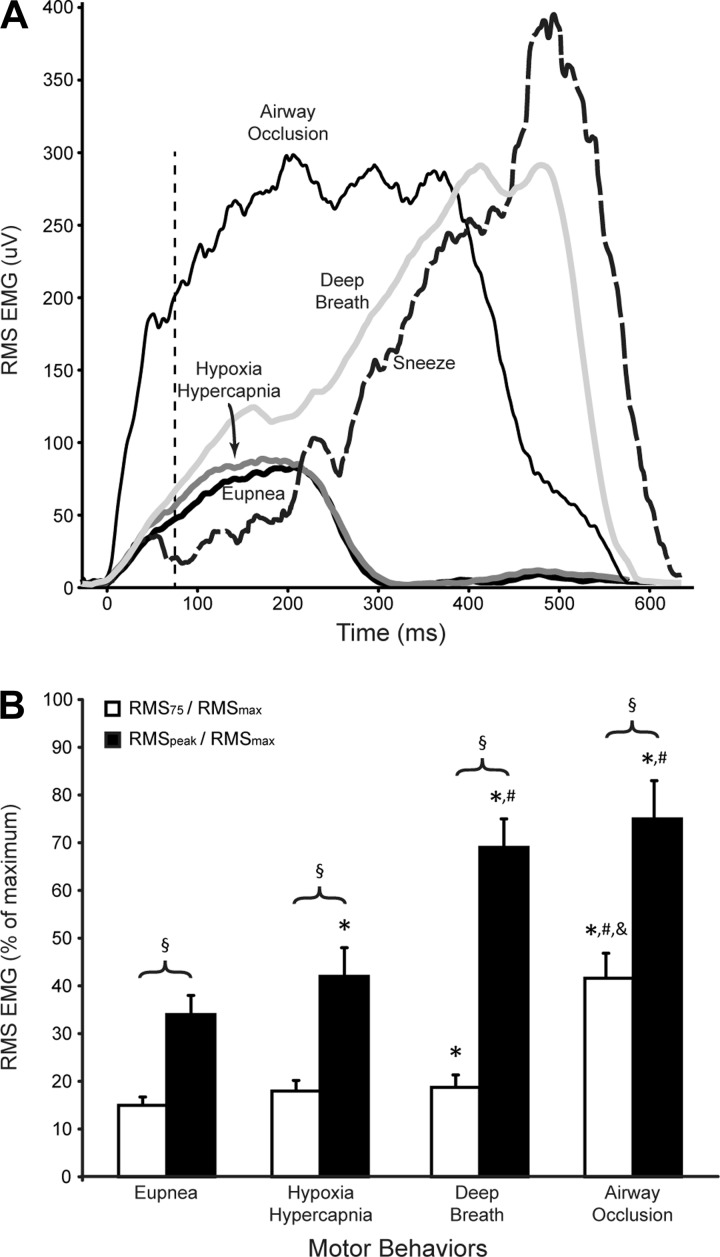
Fig. 2.
Central drive to the diaphragm muscle (DIAm), as measured by RMS DIAm EMG at the initial 75 ms (RMS75), and peak RMS EMG normalized to the maximal RMS EMG value observed during sneezing. A: representative RMS EMG traces averaged within an animal across motor behaviors. Dashed line at 75 ms indicates the point at which RMS75 was calculated (see methods for details). B: normalized RMS75 (open bars) and peak RMS EMG (black bars) across DIAm motor behaviors (expressed as % of maximum RMS EMG displayed during sneezing). RMS75 was comparable during eupnea and hypoxia-hypercapnia. Deep breaths presented higher RMS75 value compared with eupnea (P < 0.05). RMS75 was substantially higher during airway occlusion (P < 0.001). Peak RMS EMG progressively increased from eupnea to hypoxia-hypercapnia (P < 0.01) and to deep breath (P < 0.001). During airway occlusion, peak RMS EMG was comparable to deep breaths (P > 0.05) but greater than eupnea (P < 0.001) and hypoxia-hypercapnia (P < 0.001). *P < 0.05 vs. eupnea; #P < 0.05 vs. hypoxia-hypercapnia; &P < 0.05 vs. deep breaths; §P < 0.05 vs. RMS75 for same behavior.

