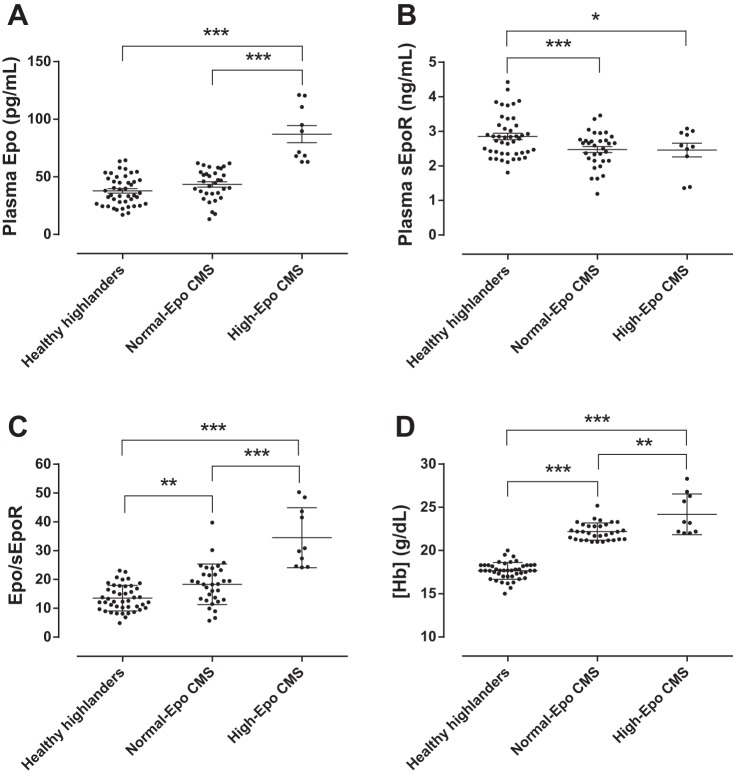
Fig. 1.
Erythropoiesis-related parameters in healthy highlanders and Chronic Mountain Sickness (CMS) patients. The figure shows the scatter graphs with individual values in each group for Hb concentration ([Hb]; A), plasma erythropoietin (Epo) concentration (B), plasma soluble Epo receptor (sEpoR) concentration (C), and the Epo-to-sEpoR ratio (Epo/sEpoR; D) between healthy highlanders and CMS individuals with normal and high plasma Epo concentration (Normal-Epo CMS and High-Epo CMS, respectively) at high-altitude. Horizontal lines represent means ± SE. *P < 0.05, **P < 0.01, ***P < 0.001.

