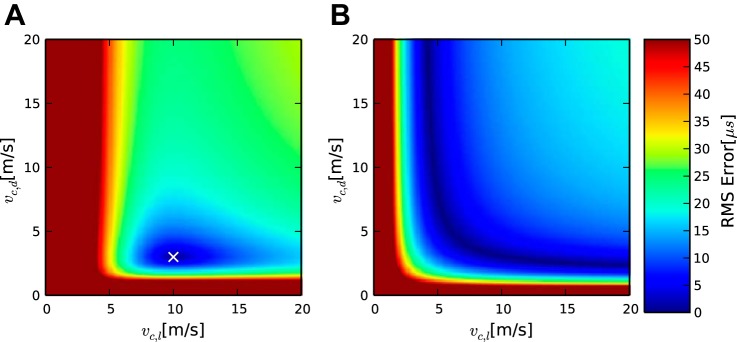
Fig. 3.

Fitting error distributions as defined in Eq. 5 for 2 simulated cases. In both cases the true value was vc,d = 3 m/s and vc,l = 10 m/s. The measurements were square (A) and linear (B) as shown in Table 1. Despite the underlying velocities being identical, the first case has a clear local minimum in the fitting error (A), while the second has the same fitting error for many parameter combinations (B).
