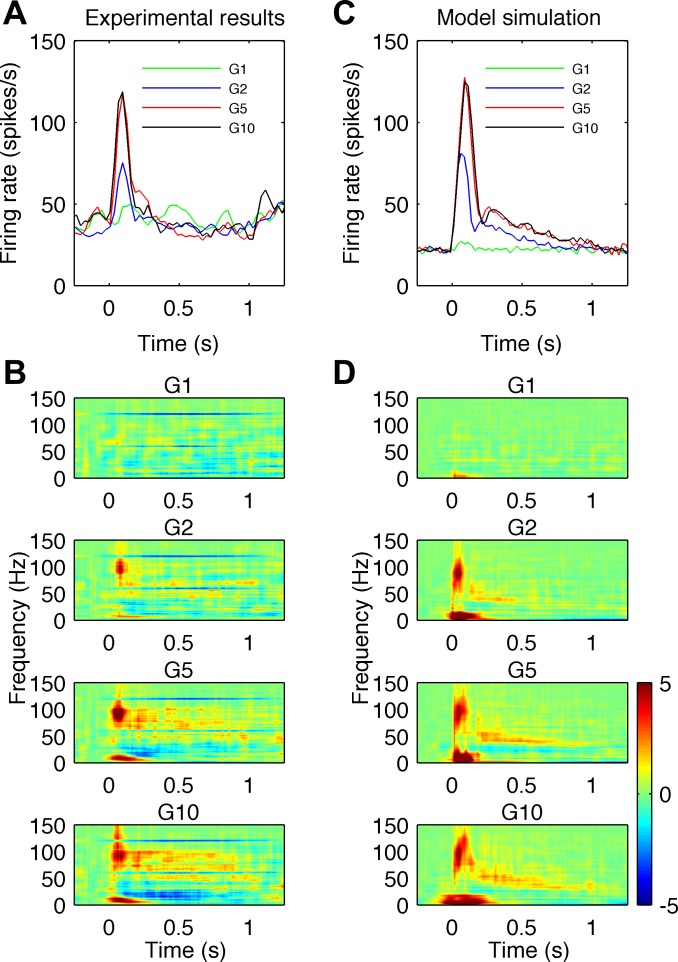
Fig. 1.
Comparison of high-gamma observed in vivo and simulated in the model during sensory stimulation for different stimulus amplitudes denoted G1, G2, G5 and G10. A and B: experimental results. C and D: model simulations. A: mean firing rate of the excited neurons shows an initial sharp peak followed by a slow decay. B: the different rows show the average time-frequency plots of power differences from baseline in local field potential (LFP) signals for different stimulus amplitudes. Maps for amplitudes G2 to G10 show an increase in power in the high-gamma frequency range (60–150 Hz) with dominant frequency ∼100 Hz in the early stimulus phase (50–200 ms) and increase in gamma and high-gamma frequencies (40–100 Hz) afterwards. A strong increase of power at low frequencies (<20 Hz) at stimulus onset and a decrease of power in the beta frequency range (10–30 Hz) after stimulus onset are also visible. C: mean firing rate across all cells in the model exhibit a similar time course to those observed experimentally. D: the time-frequency plots of simulated LFP signals exhibit similar changes in low (<20 Hz), beta, gamma and high-gamma frequency bands. Color bar showing relative energy scale in dimensionless dB units for B and D is shown on the right.

