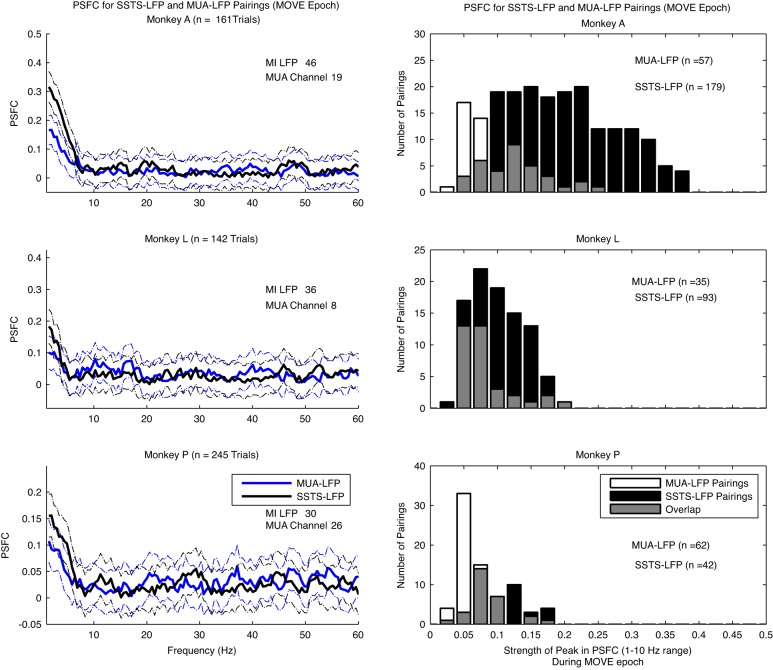
Fig. 10.
Comparison of PSFC calculated through the pairing of SSTSC-LFP vs. multiunit-LFP (MUA-LFP). Left: an example of PSFC for the MOVE epoch computed by the pairing of 1 M1 LFP channel and its associated SSTSC and PSFC computed by the pairing of the same M1 LFP channel with 1 channel of multiunit spike recording from area 2/5. An example is shown for each monkey. Error bars represent a 95% CI for PSFC based on an arctangent transformation of PSFC values. Note that the peak PSFC is in the 1–10 Hz range for both types of pairing, but the PSFC for the SSTSC-LFP pairing is stronger. Right: strength of PSFC in the 1–10 Hz range for 1 representative channel of M1 LFP paired with all area 2/5 MUA channels from a single session vs. all pairings of SSTSC-LFP for that monkey. An example of this comparison is shown for each monkey. On average, SSTSC-LFP pairings yield stronger PSFC in each monkey.

