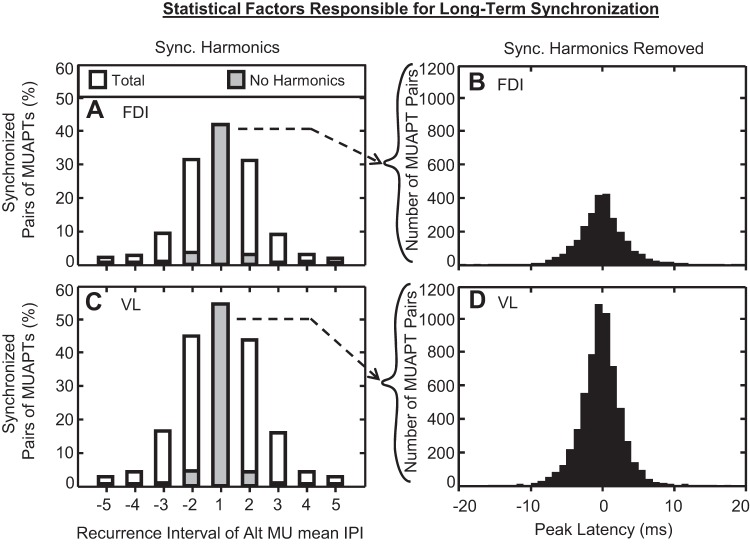
Fig. 10.
Distributions of the percentage of stationary MUAPT pairs with synchronized firing instances within each recurrence interval for (A) FDI and (C) VL data. The total amplitude of each bar indicates the total percentage of paired MUAPTs with synchronization. The amplitude of solid gray bars shows the percentage of MUAPT pairs with synchronization that did not result from harmonics (see explanation in results). From these data, all recurrence intervals outside of the 1st interval contained <4% of pairs of MUAPTs with synchronization, indicating a nonstatistically significant quantity of synchronization detections. For the remaining statistically significant synchronization detections, the distributions of the synchronization latency are shown for (B) FDI and (D) VL pairs of stationary MUAPTs. Overall, the synchronization latency data ranged from −7.4 to 7.2 and from −6.0 to 5.5 ms for 95% of FDI and VL data, respectively.

