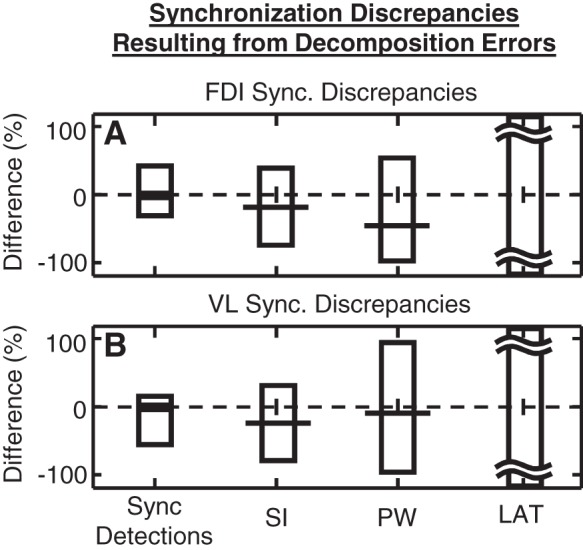
Fig. 5.

Differences in synchronization, measured between the same set of MUAPTs, obtained with and without error reduction. Synchronization was evaluated using the SigMax detection method among pairs of (A) FDI and (B) VL MUAPTs. Displayed is the average magnitude of the percent difference of additional (positive) and missed (negative) synchronization detections. Also plotted are the average percent difference (horizontal line) and 95% confidence interval (bars) of the difference in the SI, the synchronization peak width, and the synchronization latency. These discrepancies represent the changes in the amount of synchronization that result from unmitigated decomposition errors.
