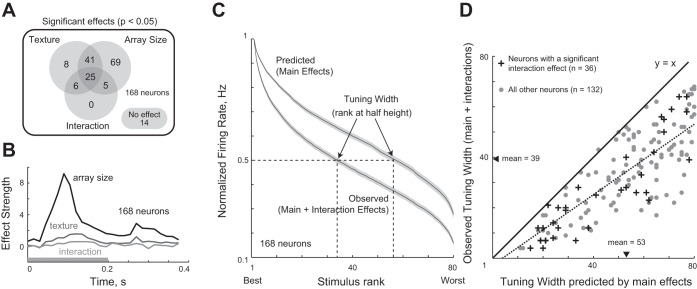
Fig. 4.
Effect of texture and array size on neuronal responses. A: distribution of the statistically significant effects in an ANOVA performed on the firing rate of each neuron with texture and array size as factors. The example neuron in Fig. 2 had a main effect of texture and array size but no interaction. B: time course of ANOVA effect strengths (averaged across all 168 neurons) for main effects of texture, of array size, and for interaction effects in 15-ms bins. C: normalized tuning curve (averaged across neurons) for the observed response and the response predicted from main effects alone. D: observed tuning width plotted against the tuning width predicted by main effects, for cells with significant interactions (crosses, n = 36) and all others (gray circles, n = 132). The dashed line is the best-fitting line and the solid line is the unit slope line.

