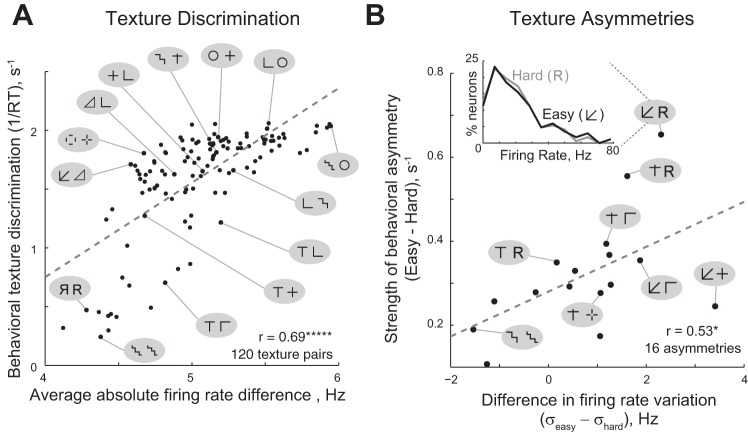
Fig. 5.
Texture discrimination in humans is predicted by monkey IT discriminability (experiment 2). A: texture discrimination in humans plotted against neuronal discriminability in monkey IT across all 120 pairs of textures tested. Example texture pairs are shown to illustrate the full range of the variation. The dashed line indicates the best-fit line. B: for pairs with a significant behavioral asymmetry in texture discrimination, we plotted the magnitude of the behavioral asymmetry against the difference in the standard deviation of firing rate across the population between the 2 textures of a pair. The dashed line indicates the best-fit line. Inset: Histogram of firing rates evoked by the easy (black) and hard (gray) targets in a texture pair with a large asymmetry (arrow/R). In all pairs (A, B), the first image of the pair is the easy target - in other words it is easier to find texture A embedded in B compared with finding B embedded in A.

