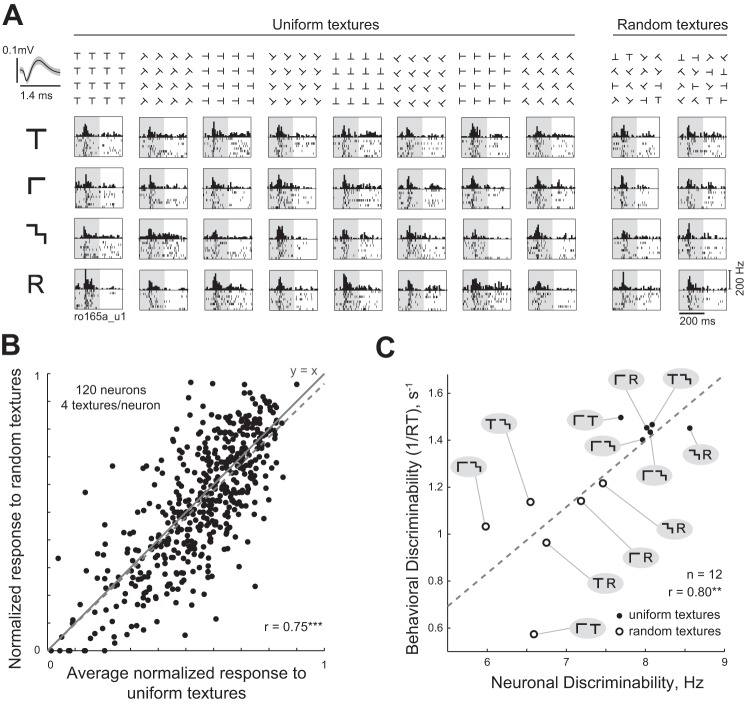
Fig. 6.
Relationship between uniform and random textures (experiment 3–4). A: responses of a sample neuron to uniform and randomly rotated textures. The 4 textures used are depicted in the leftmost column. Texture patches with elements at various orientations are shown for a sample shape (“T”) in the topmost row. Textures in the experiment were 8 × 8 arrays and are not shown in full due to space constraints. Each box represents the neuronal responses to the corresponding stimulus with conventions as in Fig. 2. B: for each neuron, the observed normalized response to the random textures is plotted against the average of responses across all orientations. This yielded a significant positive correlation (r = 0.75, P < 0.00005, dashed line). The thick gray line represents the y = x line. C: texture discrimination in humans plotted against neuronal discriminability in monkey IT for uniform and random textures. The dashed line indicates the best-fit line.

