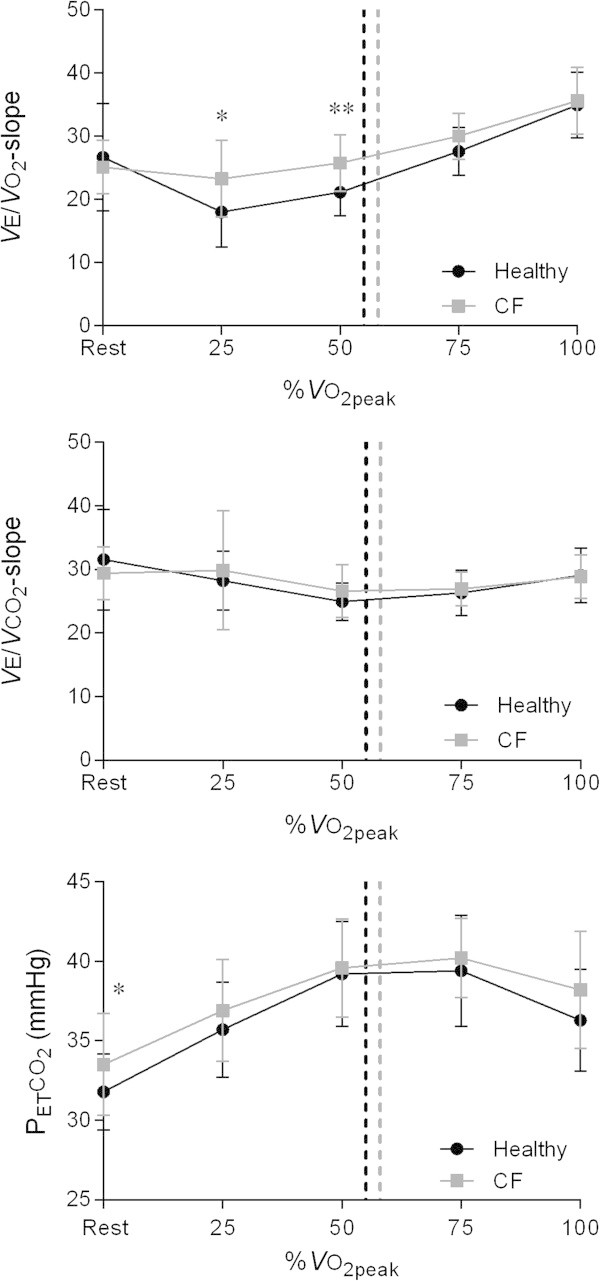
Figure 2.

Changes in VE/ VO 2-slope, VE/ VCO 2 -slope, and P ET CO 2 during exercise at similar percentages of VO 2peak in the healthy adolescents and the adolescents with CF. Dashed lines represent the ventilatory threshold in both groups. Abbreviations: CF = cystic fibrosis; PETCO2 = partial end-tidal carbon dioxide tension; VE/VCO2-slope = slope of the relationship between minute ventilation and carbon dioxide output; VE/VO2-slope = slope of the relationship between minute ventilation and oxygen uptake; VO2peak = peak oxygen uptake. *P < 0.05; **P < 0.01.
