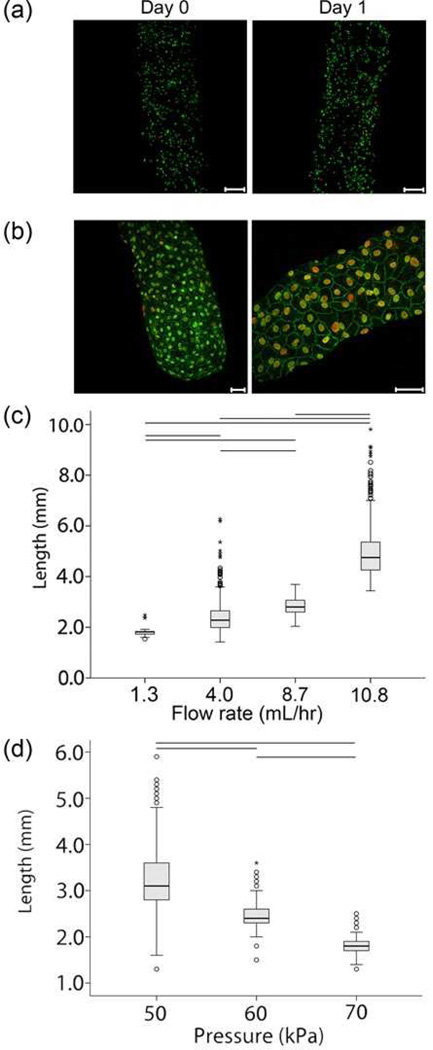
Figure 2.
(a) Live/Dead images of 3T3 cell-embedded modules produced with T-junction. 3T3 cells were suspended in neutralized collagen. The nuclei of live cells appear green while those of dead cells appear red. Cells appeared uniformly distributed within the modules and did not appear to settle to either side under gravity. Images are projections of confocal microcopy images from a z-stack series. Scale bars = 200 µm. (b) Intact endothelial cell monolayers were observed 7 days after seeding module surfaces with human umbilical vein endothelial cells, as evidenced by excellent VE-cadherin expression (green). Nuclei are counterstained in red. Scale bars = 50 µm. (c) Box plot showing the ability to increase module length by fixing air pressure and increasing the volumetric flow rate of the cell-containing collagen solution. The long module outliers were the result of drops in shearing pressure caused by fluctuations in the compressed air source. Connecting lines indicate a statistically significant difference (p<0.05) in mean value by ANOVA. n = 162 for 1.3 mL/hr., n = 374 for 4.0 mL/hr., n = 377 for 8.7 mL/hr., and n = 393 for 10.8 mL/hr. Pressure = 47.5 kPa. (d) Box plot showing the ability to increase module length by fixing volumetric flow rate and decreasing shearing pressure. Connecting lines indicate a statistically significant difference (p<0.05) in mean value by ANOVA. n = 305 for 50 kPa, n = 426 for 60 kPa and n = 390 for 70 kPa. Collagen volumetric flow rate = 5.85 mL/hr.

