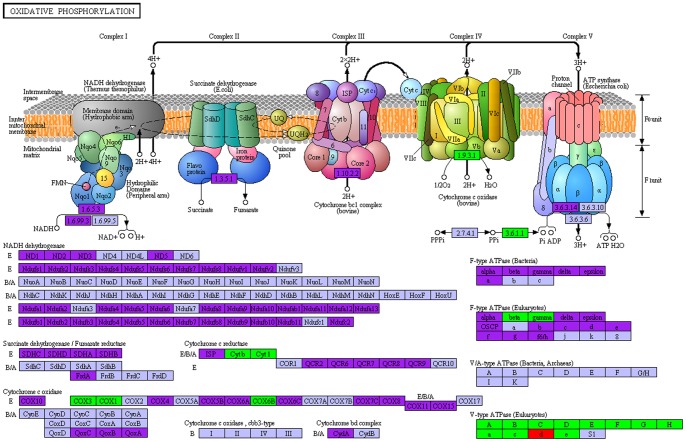
Figure 3. Oxidative phosphorylation pathway.
The pathway is based on a KEGG pathway analysis. The up-regulated and down-regulated genes are labeled by green and red, respectively, and the purple color represents genes with no expression differences between the MB and MA transcriptomes of Eriocheir sinensis.

