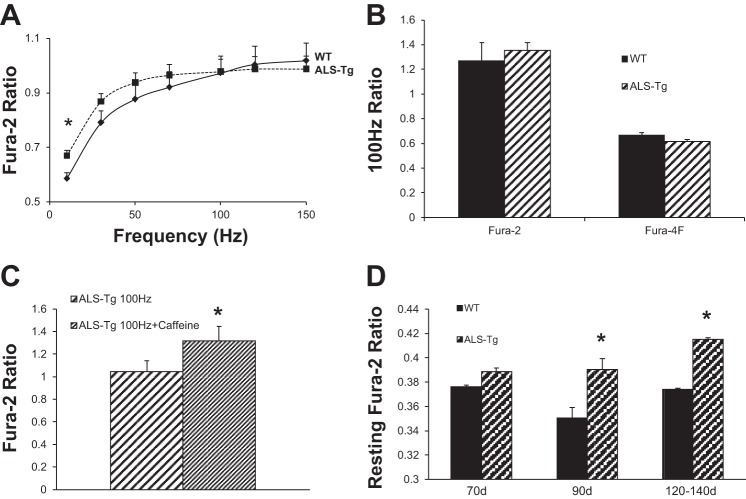
Fig. 2.
Fura-2 ratio in response to electrical stimulation in single muscle fibers from WT and ALS Tg mice. Average changes (A) in steady-state fura-2 ratios for WT (⧫; solid line) and ALS Tg (■; dashed line) mice at 120–140 days. Data represent means ± SE for all fibers: 70 days (n = 28), 90 days (n = 30), and 120–140 days (n = 42); *P < 0.05. Average change in fura-2 and fura-4F ratio at 100-Hz stimulation frequency (B) in a subset of fibers from symptomatic (132-day-old) mouse (WT n = 11); ALS Tg (n = 15). Average fura-2 response with 100-Hz stimulation with and without 5 mM caffeine (C) for ALS Tg fibers (n = 7). Resting fura-2 ratio (D) for WT (solid bars) and ALS Tg mice (hatched bars) at 70, 90, and 120–140 days; means ± SE for 70 days (n = 28), 90 days (n = 30), and 120–140 days (n = 42); *P < 0.05.

