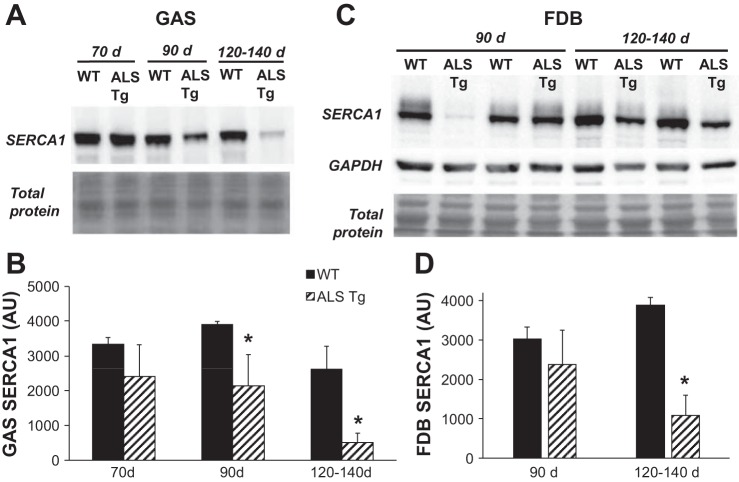
Fig. 4.
Protein levels for SERCA1 in superficial gastrocnemius (GAS) and flexor digitorum brevis (FDB) muscle of WT and ALS Tg mice. Protein levels for SERCA1 were determined by Western blot analysis and quantified by chemiluminescence. A: raw data for superficial GAS muscle for representative samples at 70, 90, and 120–140 days. Membrane staining for total protein is shown to confirm equal loading. B: average luminescence values obtained by densitometric analysis and expressed as arbitrary units (AU) for GAS muscle. C: raw data for FDB muscle for representative samples at 90 and 120–140 days. Membrane staining for GAPDH and total protein confirms equal loading. D: average luminescence values obtained by densitometric analysis shown as AU for FDB muscle. Data shown represent means ± SE for WT and ALS Tg mice at 70 days (n = 3), 90 days (n = 3), and 120–140 days (n = 5) for GAS and at 90 days (n = 4) and 120–140 days (n = 4) for FDB; *P < 0.05 vs. WT.

