
Fig. 5.
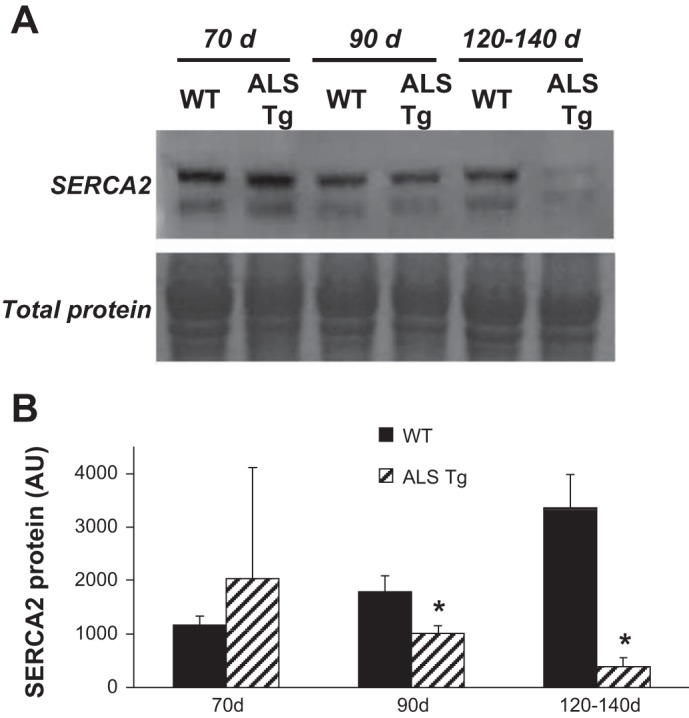
Protein levels for SERCA2 in skeletal muscle of WT and ALS Tg mice. A: SERCA2 protein level for superficial GAS muscle for representative samples at 70, 90, and 120–140 days. Membrane staining for total protein is shown to confirm equal loading. B: average SERCA2 protein levels quantified by densitometric analysis and expressed as arbitrary units are shown for superficial GAS muscle. Data shown represent means ± SE for WT and ALS Tg mice at 70 days (n = 3), 90 days (n = 3), and 120–140 days (n = 5); *P < 0.05 vs. WT.