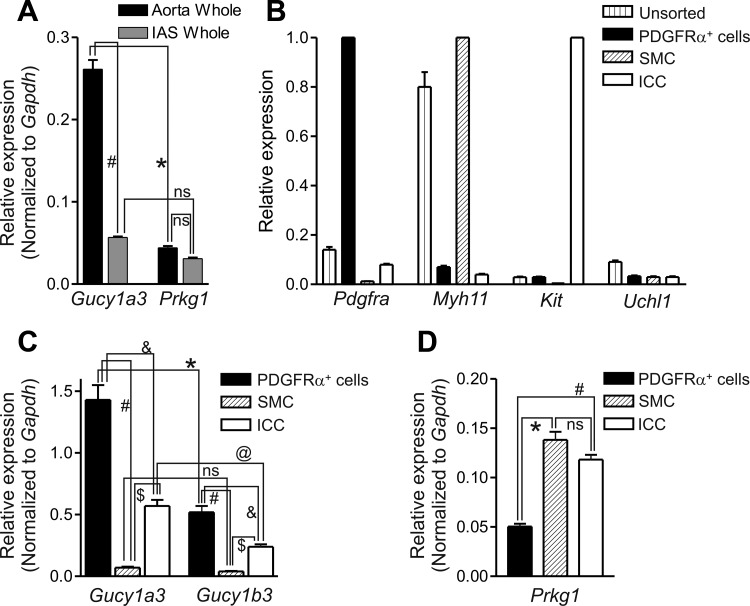
Fig. 5.
Gene expression of Gucy1 and Prkg1 in the mouse IAS and aorta. A: relative expression of Gucy1a3 (GCα gene) and Prkg1 in whole aorta and IAS tissues normalized to Gapdh. Gucy1a3 expression was significantly greater than Prkg1 expression in aorta (*P < 0.05) but not in IAS [not significant (ns)]. Gucy1a3 expression was also ∼5× greater in aorta (#P < 0.05) than in IAS. Prkg1 expression was not significantly different between muscles. B: gene expression patterns for GFP+ cells sorted from the IAS of Pdgfrαegfp/+, smMHCCre-egfp, and KitcopGFP/+ mice. Pdgfra, Myh11, and Kit levels were normalized to the cell exhibiting the greatest gene expression of these markers, i.e., PDGFRα+ cells, SMC, and ICC, respectively. Uchl1 was normalized to whole brain. The expression levels in unsorted cells is also shown. Pdgfra was most highly expressed in PDGFRα+ cells, Myh11 in SMC, and Kit in ICC. Uchl1 expression was low in all 4 cell samples. C: histogram of Gucy1a3 and Gucy1b3 (GCβ gene) expression in sorted PDGFRα+ cells, SMC, and ICC. Gucy1a3 levels were significantly greater than Gucy1b3 levels in PDGFRα+ cells (*P < 0.05) and in ICC (@P < 0.05) but not SMC (ns). Gucy1a3 and Gucy1b3 expression levels in PDGFRα+ cells were significantly greater than in ICC (&P < 0.05) and SMC (#P < 0.05) whereas Gucy1a3 and Gucy1b3 expression levels in ICC were significantly greater than in SMC ($P < 0.05). Thus the sequence of expression for both Gucy1a3 and Gucy1b3 was PDGFRα+ cells > ICC ≫ SMC. D: histogram of Prkg1 expression. Prkg1 expression was greatest in SMC and ICC and significantly less in PDGFRα+ cells (*,#P < 0.05), resulting in the sequence SMC = ICC > PDGFRα+ cells; n = 3 samples, each sample comprised of muscles from 3 animals.

