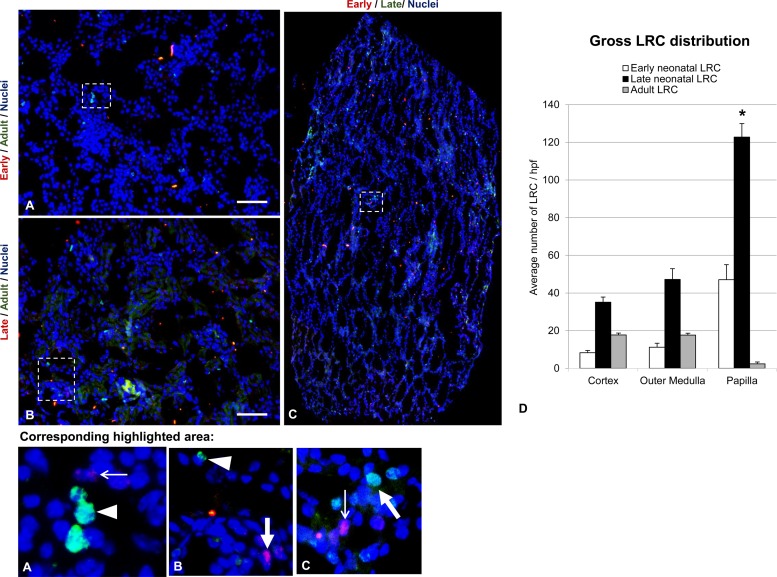
Fig. 3.
Global distributions of independent LRC populations. Double labeling of LRCs by immunofluorescence in kidneys of pair-wise labeled mice shows no colocalization of labels, suggesting independent cell populations. Highlighted regions are shown magnified in the bottom row of images. Nuclei are stained with DAPI (blue) in all images. Thin white arrows indicate a representative CldU-stained nuclei of the early neonatal LRC in the highlighted sections shown in the bottom row of images. A representative positively stained late neonatal LRC nucleus is indicated by the thick white arrow in the highlighted sections shown in the bottom row of images. A representative IdU-stained nucleus of the adult LRC is shown by the white arrowhead in the highlighted sections shown at increased magnification in the bottom row of images. The scale bar in A and B, high-powered field (hpf) images of the cortex, represents 200 μm. C: montage of hpf images of the papilla. D: graphical representation of the average number of early neonatal, late neonatal, and adult LRCs per hpf in the gross regions of the kidney. The * indicates statistical significance of the number of LRCs in papilla relative to the other 2 regions within each of the LRC populations (P < 0.001). Within each LRC population, the average numbers of labeled cells in the cortex and outer medullary regions did not differ significantly from each other.

