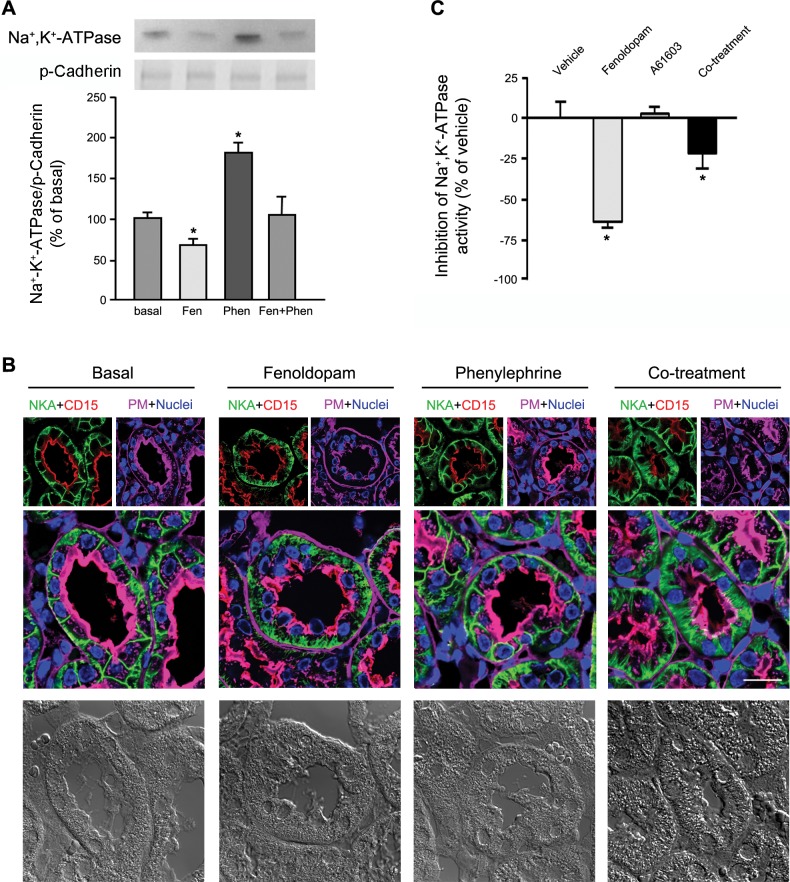
Fig. 5.
Distribution and translocation of Na+-K+-ATPase. A: hRPTCs were serum starved for 1 h and then treated with Fen and/or phenylephrine (Phen) or Veh (basal) for 30 min. PM-enriched fractions were isolated and immunoblotted for Na+-K+-ATPase. p-Cadherin was used for normalization. One group of blots is shown above the graph. *P < 0.05 vs. the other groups (by one-way ANOVA and a Holm-Sidak post hoc test). n = 3. B: C57BL/6J mice were treated with Fen (2 μg·kg−1·min−1 iv) and/or Phen (0.17 μg·kg−1·min−1 iv) or Veh (basal) for 30 min. Mice were then euthanized, and kidneys were perfused with normal saline before fixation and immunostaining for Na+-K+-ATPase (pseudocolored green) and CD15 (a proximal tubule marker, pseudocolored red). Wheat germ agglutinin tagged with Alexa fluor 647 was used to target lectins at the brush border and around the tubules (pseudocolored magenta), whereas DAPI was used to visualize nuclei (pseudocolored blue). DIC images are shown at the bottom. Magnification: ×600. Scale bar = 10 μm. C: hRPTCs grown to confluence in Transwell 12-well inserts were serum starved for 2 h before treatment with Fen (1 μM) and/or A61603 (100 nM) for 30 min. Cells treated with ouabain (50 μM) for 1 h served as controls and were used to calculate the percentage of ouabain-inhibitable Na+ activity. *P < 0.05 vs. the other groups (by one-way ANOVA and a Holm-Sidak post hoc test). n = 3.

