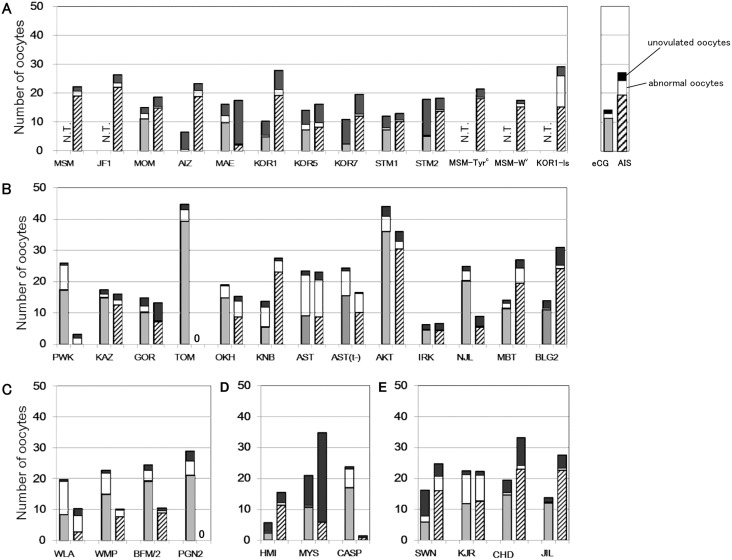
Figure 1. The mean numbers of oocytes collected per female after eCG or AIS treatment.
Each bar shows the total number of oocytes consisting of normal ovulated oocytes (gray or hatched), abnormally ovulated oocytes (white), and unovulated ovarian oocytes (black). In 34 out of 37 strains, more than 15 oocytes per female were obtained either by eCG or AIS superovulation treatment. In M. m. molossinus, the strains known to be highly poor responders to eCG were not tested for eCG to save the number of animals used (shown as N.T.). The detailed data are summarized in Table S1.

