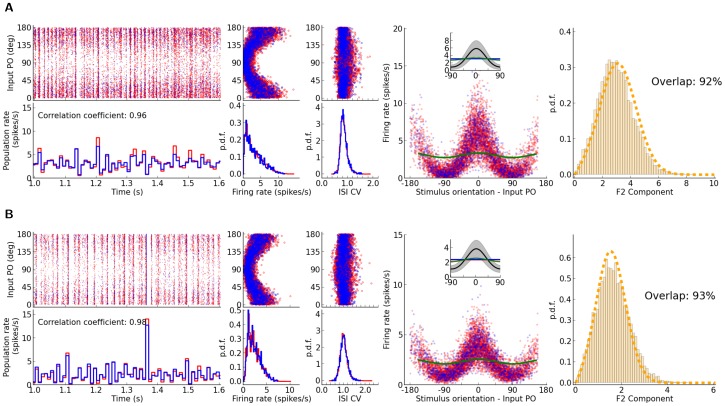
Figure 4. The impact of the strength of recurrent coupling on the distribution of selectivities.
The figure layout is similar to Fig. 1 (panel (E) not included), shown are networks with stronger recurrent couplings. In (A), the recurrent coupling is increased by doubling the connection density; in (B), this is further enhanced by doubling all recurrent weights. The parameters of network simulations are: (A)  ,
,  ,
,  ,
,  ,
,  ,
,  ,
,  , and (B)
  ,
,  ,
,  ,
,  ,
,  ,
,  ,
,  . The predicted distributions are computed by considering
  (see Fig. 3).

