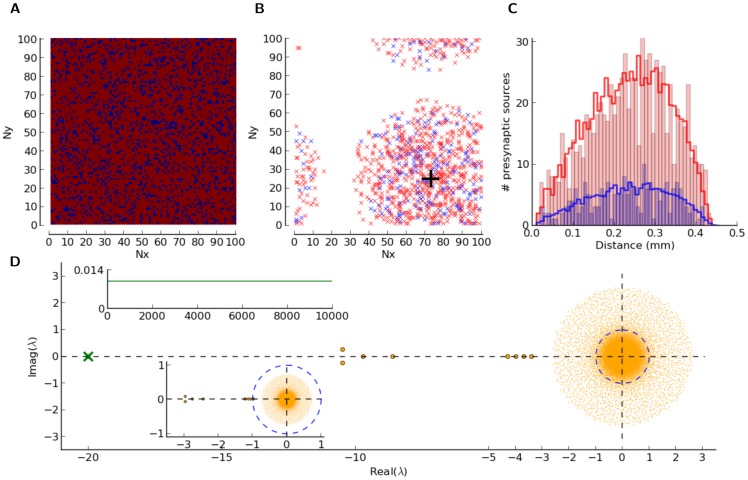
Figure 5. Networks with distance-dependent connectivity.
(A) Random positioning of  excitatory (red) and
  inhibitory (blue) neurons in a square, representing a flat
  sheet of cortex, wrapped to a torus. (B) For a sample (excitatory) neuron (large black cross), positions of excitatory (red) and inhibitory (blue) pre-synaptic neurons are explicitly shown as little crosses. A Gaussian connectivity profile with
  was assumed. For each post-synaptic neuron, we fixed the number of randomly drawn pre-synaptic connections of either type, i.e.
  and
and  (
( ). Multiple synapses and self-coupling were not allowed. (C) Histogram of distances to pre-synaptic neurons for the sample neuron (bars) and for the entire population (lines). (D) Eigenvalue spectrum of the weight matrix,
  . Weights are normalized by the reset voltage,
  , leading to
  or
or  , depending on whether the synapse is excitatory or inhibitory, respectively. We used
  . For better visibility, the eigenvalues outside the bulk of the spectrum are shown by larger dots. The green cross marks the eigenvalue corresponding to the uniform eigenmode, which is plotted in the top inset. Re-normalized spectrum, according to the gain
  , is shown in the bottom inset; i.e.
  and
and  , for excitatory and inhibitory connections, respectively.

