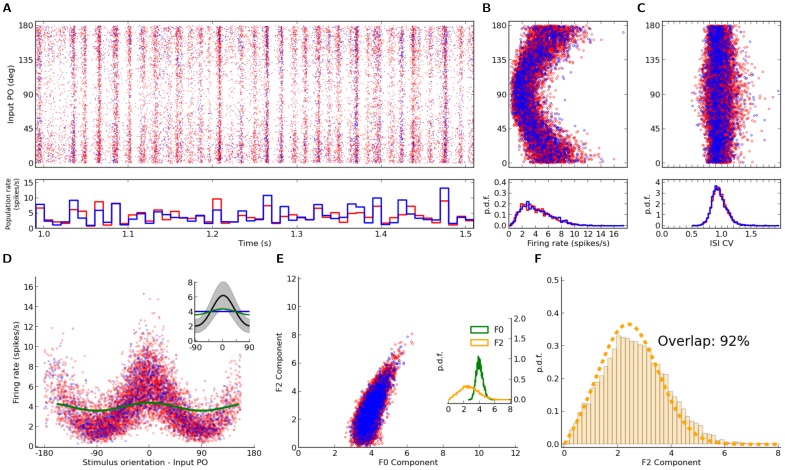
Figure 6. Distribution of orientation selectivity in a network with distance-dependent connectivity.
Same figure layout as Fig. 1, for a network with distance-dependent connectivity, similar to Fig. 5. Parameters of the network simulation are:  ,
,  ,
,  ,
,  ,
,  ,
,  ,
,  ,
,  . Note that the distribution of F2 components is computed by using the stimulus gain
  , as in Fig. 3.

