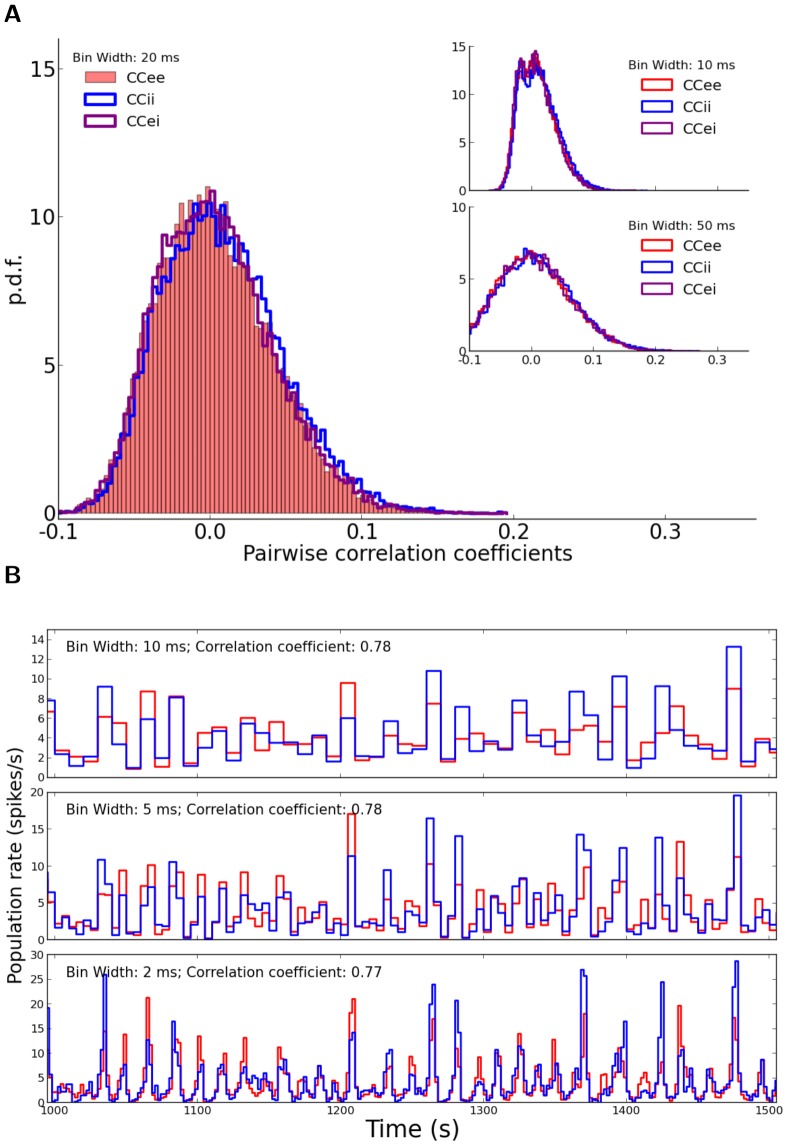
Figure 7. Correlations in a network with distance-dependent connectivity.
Distribution of correlation coefficients for pairs of neurons (A) and temporal correlation of population activities (B) in the example network of Fig. 5 with distance-dependent connectivity. Other conventions are similar to Fig. 2.

