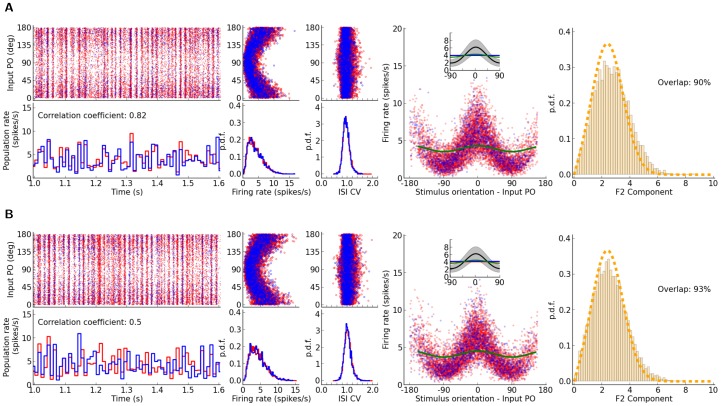
Figure 9. The impact of spatial extent of excitation and inhibition on the distribution of F2 components.
Same illustration as in Fig. 4, for simulations with different extents of excitatory and inhibitory connectivity. (A) shows the results for a network with inhibition being more localized than excitation ( and
and  ). In (B) we show the results for excitation being more localized than inhibition (
 and
and  ). Other parameters are the same as in Fig. 6. The distribution of F2 components is computed after re-normalization of the connectivity matrix by
  , as explained before.

