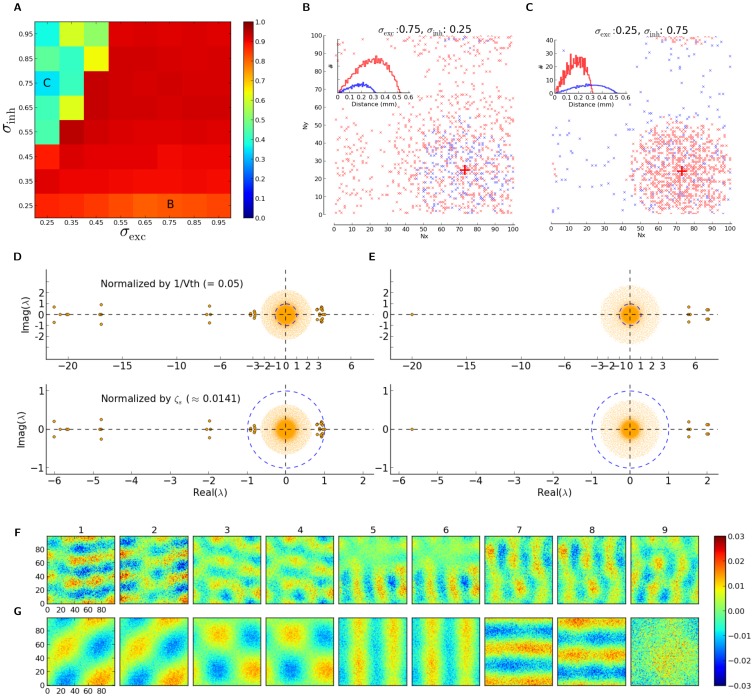
Figure 10. Accuracy of the linear prediction for different spatial extents of excitation and inhibition.
(A) The overlap index (using  ) is plotted for networks with different extents of excitation and inhibition. (B, C) Pre-synaptic connections for a sample post-synaptic neuron, along with the histogram of distances to pre-synaptic neurons for the entire population (inset), are shown here for two extreme cases, marked in panel (A). (D, E) Eigenvalue distribution of the example networks in (B) and (C), respectively. Two ways of normalization of the weight matrix are compared in the top and bottom panels. (F, G) First nine eigenmodes, corresponding to the nine largest positive eigenvalues (in terms of their real component), are plotted for the example networks in (A). Panels (F) and (G) correspond to the networks in (B) and (C), respectively. Note that the ninth eigenvector in (G) corresponds to an eigenvalue from the bulk of the spectrum in (E). Only the real part of the components of the eigenmodes are plotted.

