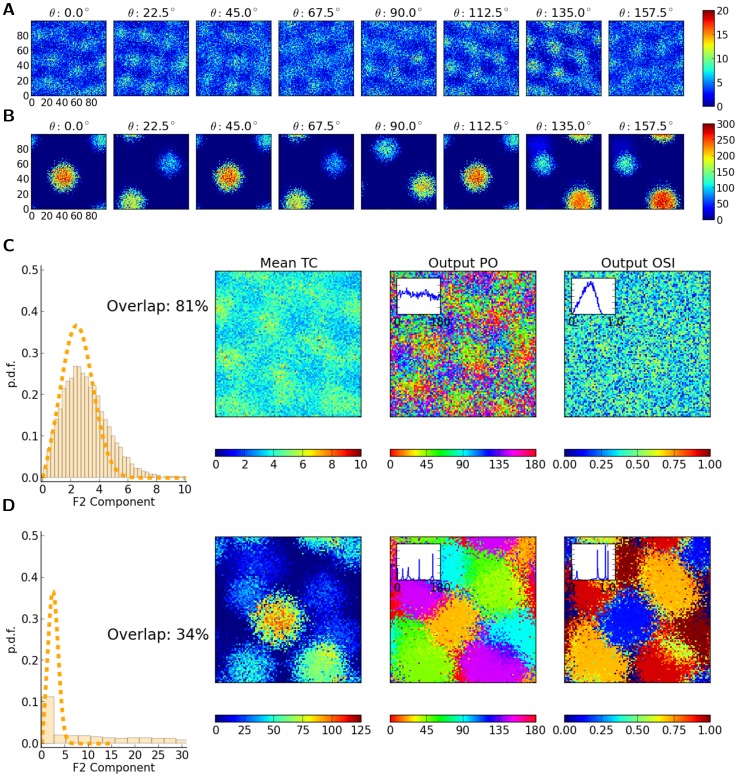
Figure 12. Dynamic instability leads to nonlinear distortions in the processing of orientation selectivity.
(A, B) Mean firing rate of neurons in the network (the same networks as in Fig. 11, (A) and (B), respectively) in response to stimuli of different orientations. (C, D) For the networks in (A) and (B), respectively, the distributions of F2 components are compared with the linear prediction (using  , dashed line) in the first column. The subsequent columns depict the map of average (over orientation) tuning curves (Mean TC), Output PO and Output OSI. Insets in the last two columns show the distribution of Output PO and Output OSI, respectively.

