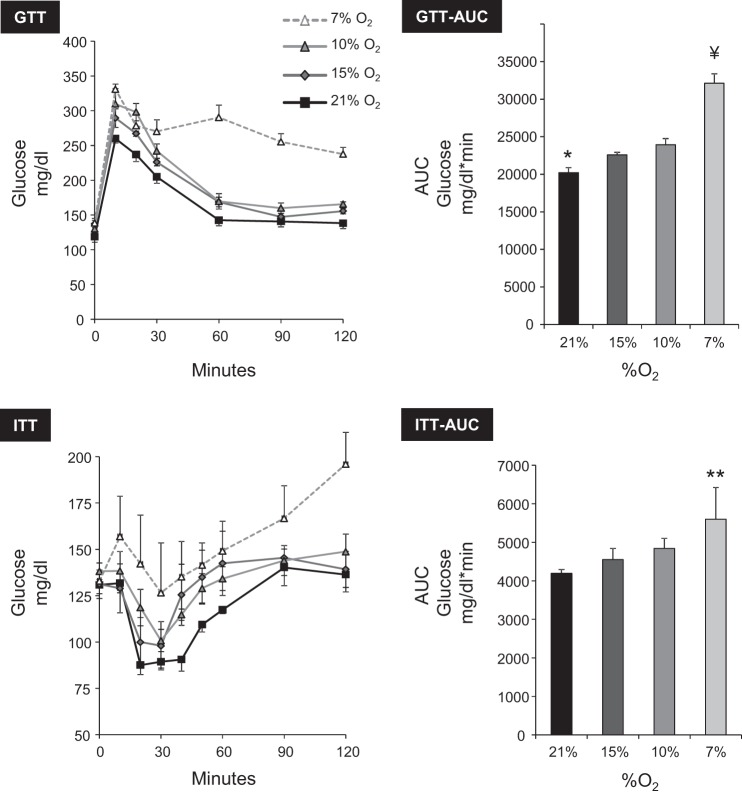
Fig. 4.
Effect of SH on glucose tolerance [ip glucose tolerance test (GTT)] and insulin sensitivity [insulin tolerance test (ITT)]. The glucose area under the curve (AUC) was used for statistical analysis. The degree of glucose intolerance and insulin resistance correlated with severity of hypoxia. GTT AUC: ANOVA P < 0.0001; *P < 0.05 vs. 15 or 10% O2. ITT AUC: ANOVA P < 0.0001; **P < 0.01 vs. other groups; ¥P < 0.01 vs. ODI 30 or ODI 60.

