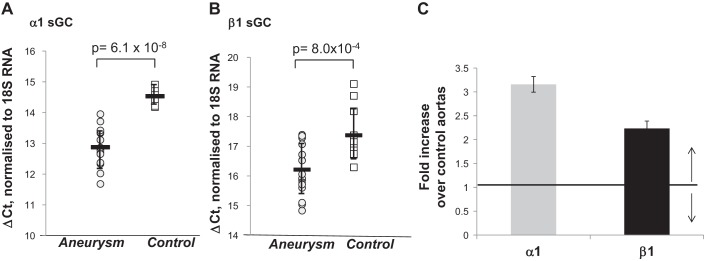
Fig. 2.

The level of total α1 and β1 sGC transcripts is increased in human aortas with aneurysm. The levels of α1 and β1 transcripts in control aortas and aortas with aneurysm were determined by qRT-PCR using commercial pan-specific α1 (A) and β1 (B) primers and probes. Circles and squares represent the ΔCt value for each individual aortic sample normalized to 18S RNA. These values are inversely proportional to the level of sGC transcripts. Means (horizontal bars) ± SD are shown. C: the fold overexpression for α1 and β1 sGC transcripts in samples with aneurysm over control samples was determined using ΔΔCt method as detailed in methods. P values for diseased vs. control samples are indicated.
