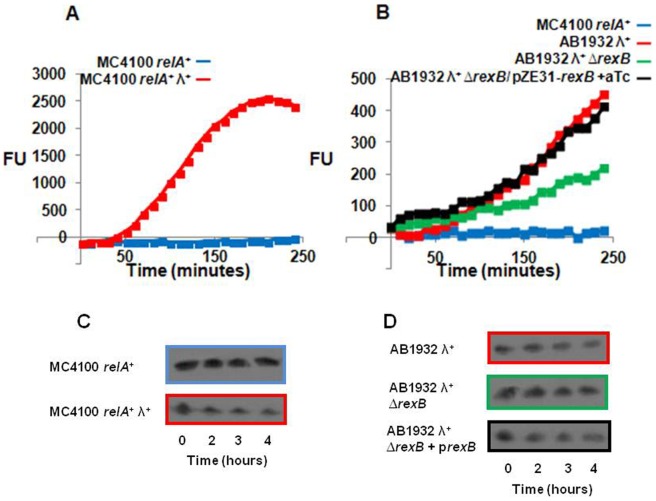
Figure 3. λ Lysogens overcome the inhibitory effect of mazEF on the SOS response.
We determined the SOS response by measuring the fluorescence of the reporter plasmid pL(lexO)-gfp (A, B), and by LexA degradation (C, D). We used E. coli MC4100relA + as a control strain, and two experimental parent strains lysogenized by phage λ: MC4100relA + λ + (A, C), and AB1932λ +, AB1932λ +ΔrexB, AB1932λ +ΔrexB/pZA31-rexB (B, D). The strains in A and B harbored plasmid pL(lexO)-gfp. Cells were grown as described in the Legend to Figure 1, except that the ampicillin concentration was (25 µg/ml), and chloramphenicol (6.25 µg/ml) was added to cells harboring plasmid pZE31-rexB. At O.D.600 0.5–0.6, the strains harboring plasmid pZE31-rexB were induced by the addition of aTc (0.5 µg/ml), and incubated without shaking at 37°C for 30 min after which we added NA (10 µg/ml). We measured fluorescence (FU) (A and B) by fluorometer or LexA degradation (C and D) over a period of 4 hours. The values shown are relative to those of cells not treated by NA. All data are representative of three independent experiments. The colors surrounding the gels in C and D correspond to the colors representing the samples in A and B.

