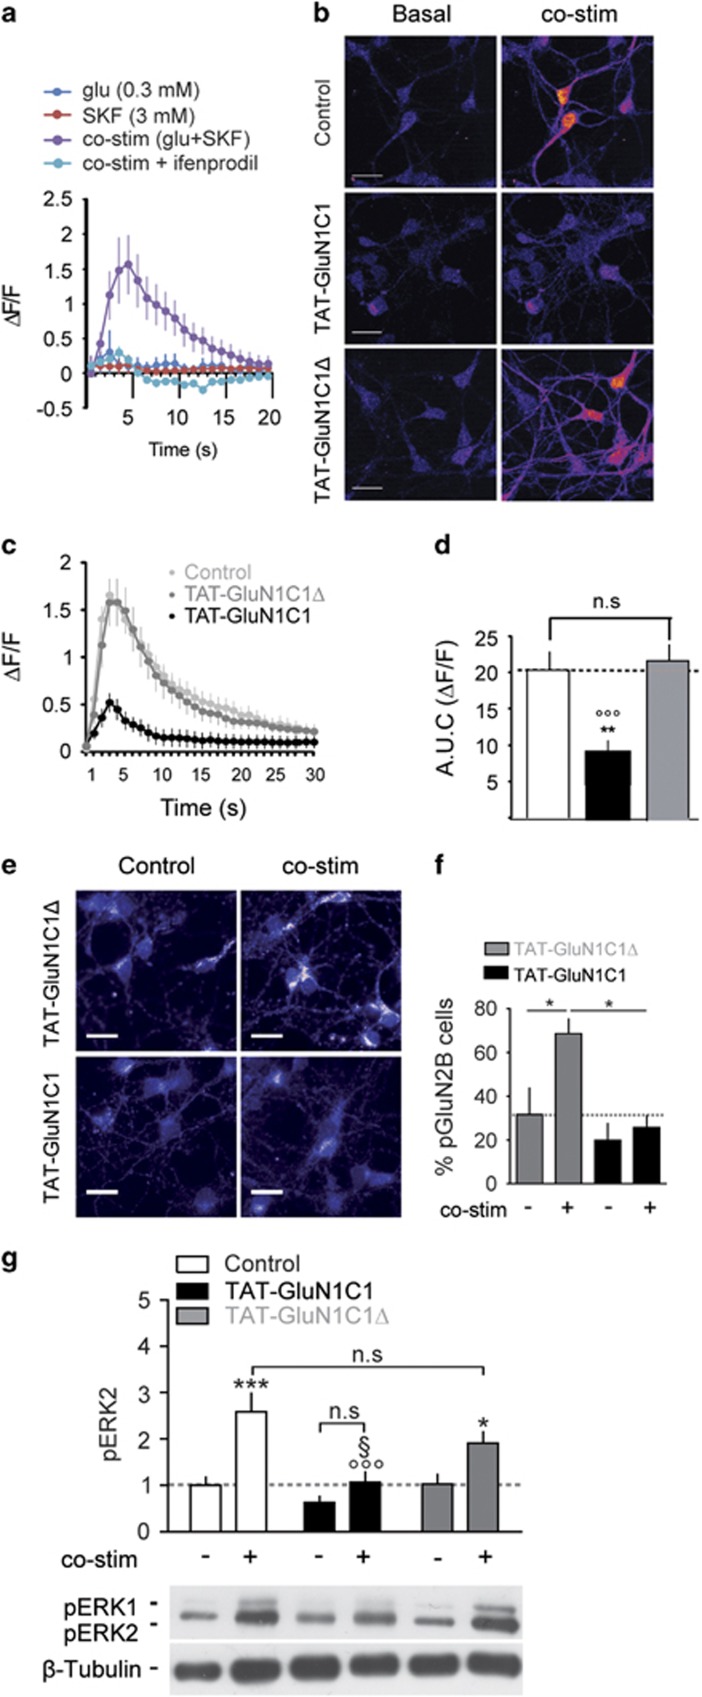
Figure 2.
Dopamine D1 receptor (D1R)/GluN1 complexes control D1R-mediated potentiation of NMDAR signalling to extracellular signal-regulated kinase (ERK). (a) Calcium profiles (ΔF/F±s.e.m.) from medium spiny neurons (MSNs) treated with glutamate or SKF38393 or both (co-stim) in the absence or presence of ifenprodil (10 μM). (b) Images of calcium signals under basal conditions (left) and at the peak response induced by the co-stimulation in the absence (Control, top row), or presence of TAT-GluN1C1 (middle) or TAT-GluN1C1Δ (bottom). (c) Calcium profiles and (d) corresponding area under the curves (AUC) from neurons treated co-stimulated in the absence or presence of TAT-GluN1C1 (black) or TAT-GluN1C1Δ (grey); N=3–5, n=72–176 cells). One-way analysis of variance (ANOVA), Bonferroni post hoc test, **P<0.01; (Control); °°°P<0.001; (TAT-GluN1C1Δ); (e) Immunocytochemistry of phospho-Tyr1472-GluN2B (pGluN2B) and (f) percentage of pGluN2B-positive neurons from MSNs pre-treated with TAT-GluN1C1Δ or TAT-GluN1C1 and co-stimulated or not (Control) for 10 min. *P<0.05; N=4; one-way ANOVA, Newman–Keuls post hoc test. (g) ERK1/2 phosphorylation (pERK) measured by immunoblot from MSN co-stimulated or not in absence (white) or presence of TAT-GluN1C1 (black) or TAT-GluN1C1Δ (grey). *P<0.05; ***P<0.001 (Control); °°°P<0.001 (co-stim); §P<0.05 (TAT-GluN1C1Δ, co-stim); N=5; two-way ANOVA, Bonferroni post hoc test.

