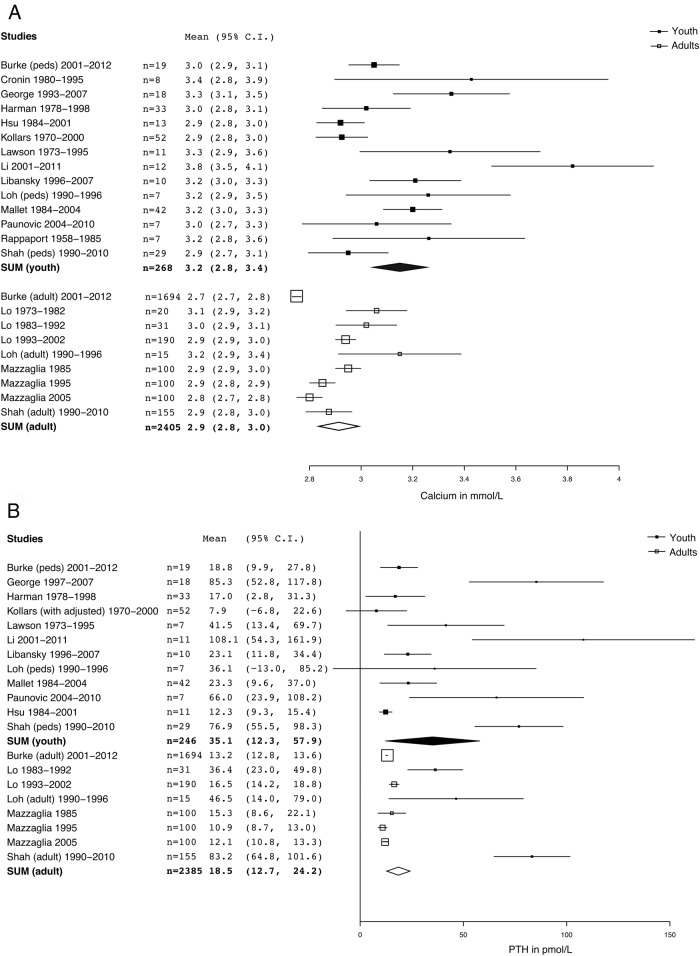
Figure 2.
A. Forest plot of comparison of serum total calcium between juvenile PHPT and adult PHPT. Serum calcium in pediatric PHPT is significantly increased relative to Adult PHPT, P < .05 (paired t test with Welch's correction for unequal variances), pediatric mean, 3.2 mmol/L (95% CI, 2.8–3.4) vs 2.9 mmol/L (95% CI, 2.8–3.0). Summary or individual statistics for calcium were reported for all of the subjects in this study (n = 2673). Studies separating out multiple decades [Lo et al (24) and Mazzaglia et al (25)] are graphically represented by a square for each group. Square size is proportional to n and SD. B. Forest plot of comparison of serum PTH between juvenile PHPT and adult PHPT. Differences between groups are not statistically significant, P = .17 (paired t test with Welch's correction for unequal variances); pediatric mean, 35.1 pmol/L (95% CI, 12.2–58.0) vs 18.5 pmol/L (95% CI, 12.7–24). Summary or individual statistics for PTH were reported for 2388 subjects. Studies separating out multiple decades [Lo et al (24) and Mazzaglia et al (25)] are graphically represented by a square for each group. Square size is proportional to n and SD.

