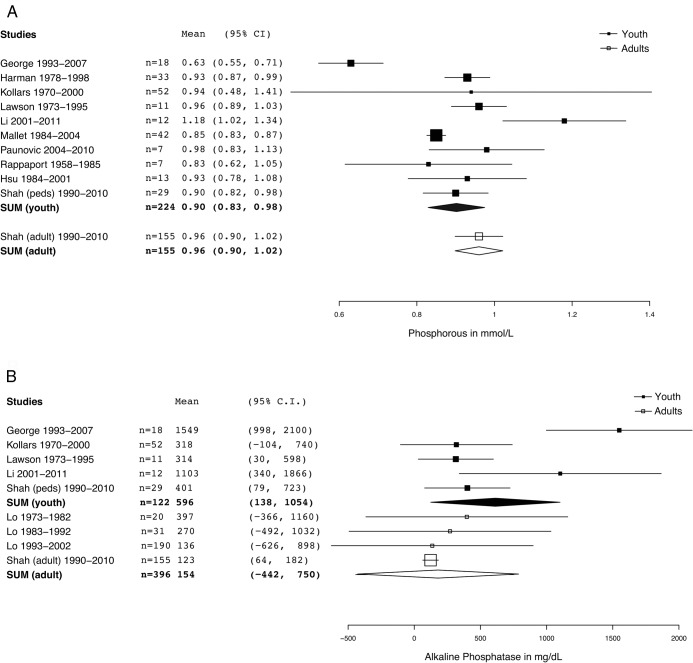
Figure 3.
A. Forest plot of comparison of phosphorus between juvenile PHPT and adult PHPT. Differences between groups are not statistically significant, P = .37 (paired t test with Welch's correction for unequal variances); pediatric mean, 0.90 mmol/L (95% CI, 0.83–0.98) vs 0.96 (95% CI, 0.90–1.02). Summary or individual statistics for serum phosphorous were reported for 379 subjects. B. Forest plot of comparison of alkaline phosphatase between juvenile PHPT and adult PHPT. Differences between groups are not statistically significant, P = .25 (paired t test with Welch's correction for unequal variances); pediatric mean, 596 mg/dL (95% CI, 133–1059) vs 154 mg/dL (95% CI, 443–752). Summary or individual statistics for Alkaline phosphatase were reported for 363 subjects.

