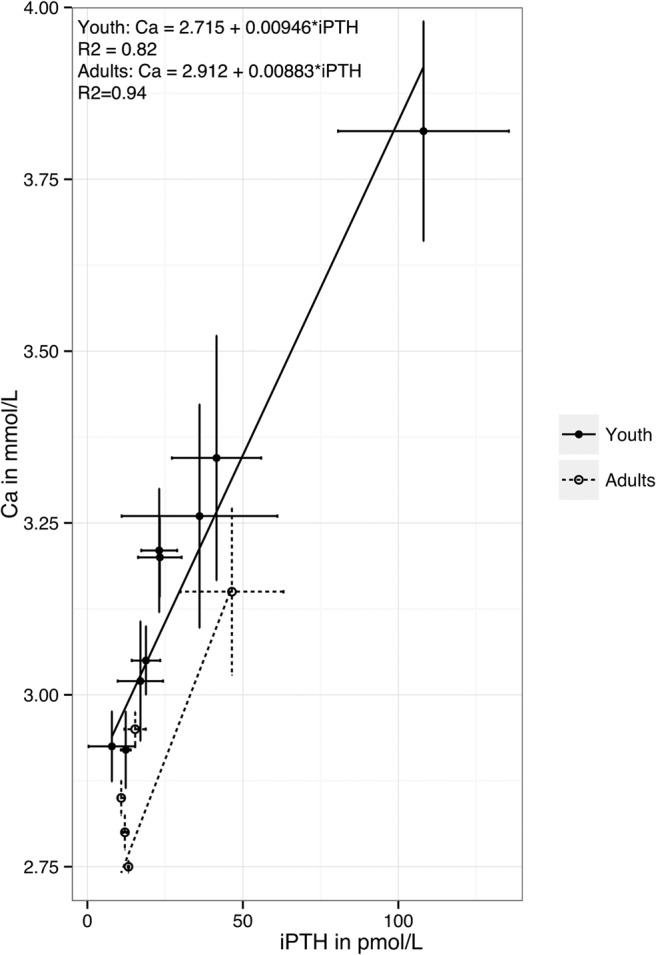
Figure 5.

Comparison of frequency-weighted regression of calcium vs PTH curve in pediatric PHPT and adult PHPT in studies with mean gland size < 1188 mg. For juveniles the linear regression gives: calcium = 2.715 + 0.00946×iPTH (R2 = 0.82), for adults: calcium = 2.912 + 0.00883*iPTH (R2 = 0.94). These lines provide an estimation of the relationship between calcium and PTH. Thus, differences between the lines imply that the regulation of calcium by PTH is different between these two groups.
