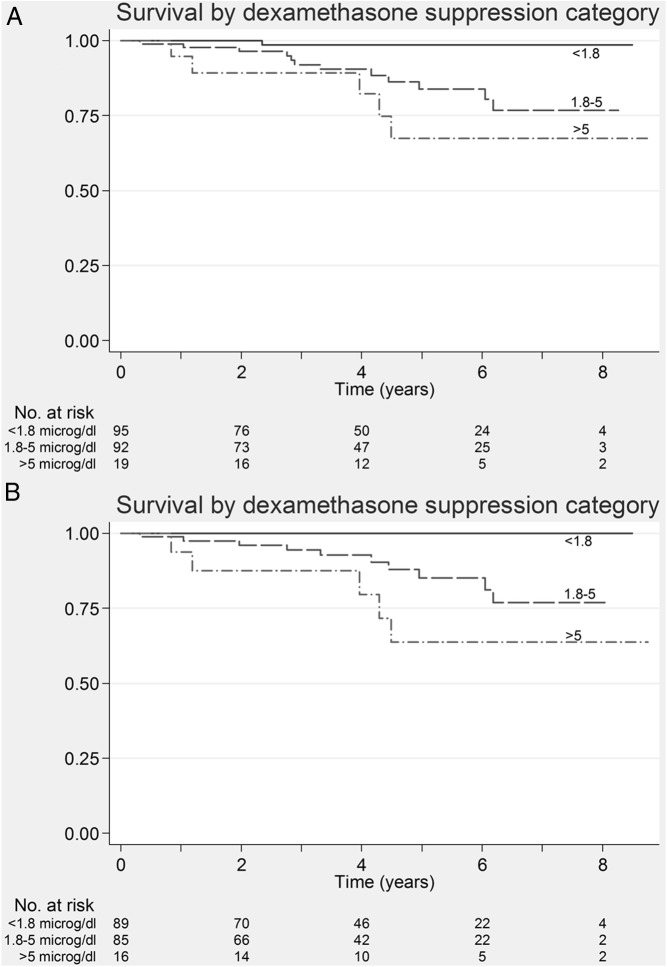
Figure 2.
A, Kaplan-Meier survival curve in patients categorized according to post dexamethasone cortisol levels. This shows worsening survival with increasing post dexamethasone serum cortisol levels (log rank P = .001) categorized using standard cut-offs from literature (<1.8 μg/dL, 1.8–5 μg/dL, >5 μg/dL) (Primary analysis). B, Kaplan-Meier survival curve in patients categorized according to post-dexamethasone cortisol levels. This shows worsening survival with increasing post dexamethasone serum cortisol levels (log-rank P < .001) after excluding patients with benign adrenocortical adenomas and extra-adrenal malignancy. Hazard ratios could not be calculated because no patients from the <1.8-μg/dL group died (subanalysis).

