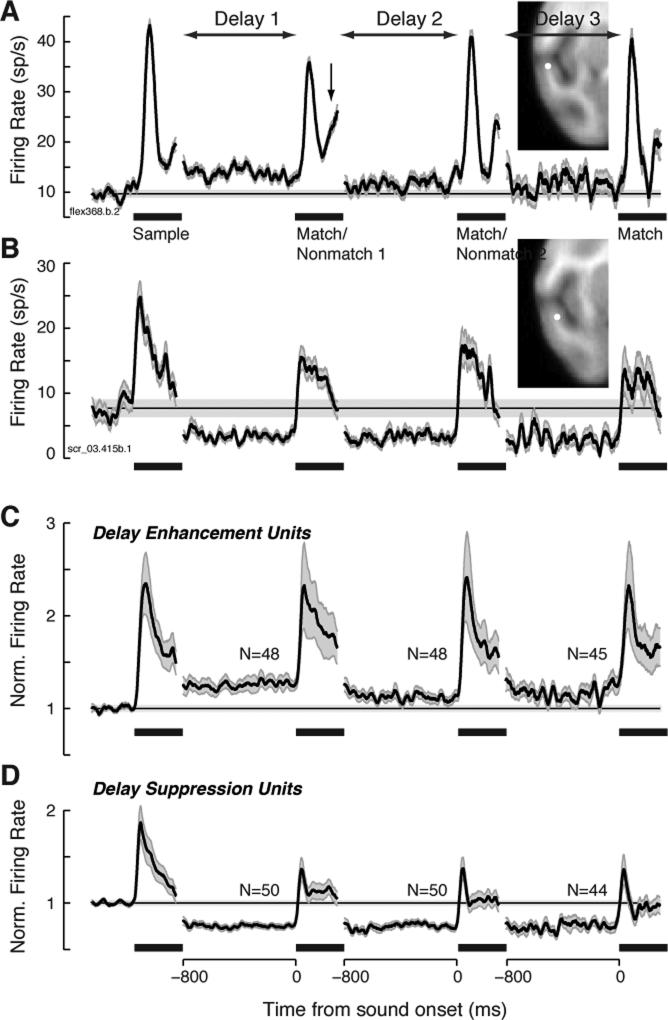
Figure 2.
Firing rate during the interstimulus delay periods was suppressed or elevated relative to baseline in 35% of units. (A) Example unit showing delay enhancement (DE), recorded in field RTp of the rostral supratemporal plane (see inset). The late component of the auditory response to Match 1 (arrow) shows evidence of match enhancement (ME), as illustrated for this same unit in Supplemental Fig. S3. Black traces plot mean firing rate across all correct trials, the horizontal line marks baseline firing rate, and gray shading indicates ± 1 SEM across trials; black bars indicate time of stimulus presentation. Noisier traces at later delays are attributable to averaging fewer correct trials, owing to the sequential nature of the task, and to the higher error rate on long trials than on short trials. Traces are discontinuous because delay duration varied from 800 to 1200 ms; for simplicity, activity is plotted for the 800 ms preceding the next stimulus onset. (B) Example unit showing delay suppression (DS), recorded at the medial edge of RTp (see inset). (C) Mean normalized firing rate for the subset of units exhibiting DE (48/280, 17%). Traces from delay 3 include fewer units than traces from delays 1 and 2 because one of the three subjects was not tested with the longest trial type. Firing rate was normalized within each unit by dividing by its baseline rate, before averaging across units (shading indicates ±1 SEM across units). (D) Mean normalized firing rate for the subset of units exhibiting DS (50/280, 18%).

